 从micrometer计量器角度快速上手promQL
# 写在文章开头
因为近期工作比较忙碌,所以文章的更新相对慢了一些,近期笔者集成了一些比较核心的监控指标交由Prometheus采集,并通过promQL进行查询分析实现图表渲染。因为这一套完整的监控流程涉及计量器指标采集再通过Prometheus构建时间序列,再通过grafana结合promQL查询渲染,所以了解每一个环节的实现和理念,才能准确串联上述流程。
遗憾的是,就笔者近期了解的情况来看,这方面的资料要么面向全流程搭建的新手教程,要么就是非常突兀的promQL基本说明,并没有做到笔者所认为的全流程泛化梳理,所以笔者打算综合这些理念,结合一个比较有代表意义的案例将这些概念串联,以帮助读者更好的理念和运用监控。
我是 SharkChili ,Java 开发者,Java Guide 开源项目维护者。欢迎关注我的公众号:写代码的SharkChili,也欢迎您了解我的开源项目 mini-redis:https://github.com/shark-ctrl/mini-redis (opens new window)。
为方便与读者交流,现已创建读者群。关注上方公众号获取我的联系方式,添加时备注加群即可加入。
# 案例项目前置说明
本文通过spring boot web项目作为演示案例,所有的采集指标都会通过Prometheus数据源发布到rgafana上并通过promQL进行增强渲染,所以该项目主要会引入暴露springboot监控指标进行和prometheus套件依赖:
 <!--暴露spring监控指标-->
        <dependency>
            <groupId>org.springframework.boot</groupId>
            <artifactId>spring-boot-starter-actuator</artifactId>
            <version>2.4.1</version>
        </dependency>

        <!--用于导出prometheus系统类型的指标数据-->
        <dependency>
            <groupId>io.micrometer</groupId>
            <artifactId>micrometer-registry-prometheus</artifactId>
            <version>1.1.4</version>
        </dependency>
2
3
4
5
6
7
8
9
10
11
12
13
同时笔者也变写了一个测试的TestController:
- 声明计时器采集
test0的耗时(本质上通过休眠模拟)指标 - 其余两个接口通过
@Timed注解收集接口时间维度的各项指标
@RestController
@Slf4j
public class TestController {

    @Autowired
    private MeterRegistry registry;
    private Timer timer;


    @PostConstruct
    private void init() {
        //名称设置为http.timer,标签设置为uri为/hello,选用合适的名称辅助开发推断理解
        timer = Timer
                .builder("http.timer")
                .publishPercentiles(0.1, 0.5, 0.95) //发布百分位数区间
                .description("接口请求耗时统计") // 指标的描述
                .tags("uri", "/hello") // url标签指明为hello
                .register(registry);


    }


    @GetMapping("/test0")
    public String function() {
        timer.record(RandomUtil.randomInt(200), TimeUnit.MILLISECONDS);
        return "test0";
    }

    @GetMapping("/test1")
    @Timed
    public String test1() {
        ThreadUtil.sleep(RandomUtil.randomInt(200));
        return "test1";
    }

    @GetMapping("/test2")
    @Timed
    public String test2() {

        ThreadUtil.sleep(RandomUtil.randomInt(200));
        return "test2";
    }

}
2
3
4
5
6
7
8
9
10
11
12
13
14
15
16
17
18
19
20
21
22
23
24
25
26
27
28
29
30
31
32
33
34
35
36
37
38
39
40
41
42
43
44
45
因为用到的计时器注解 @Timed,所以我们还需要配置TimedAspect创建注解的代理是使之生效:
@Configuration
public class TimedConfiguration {
    @Bean
    public TimedAspect timedAspect(MeterRegistry registry) {
        return new TimedAspect(registry);
    }
}
2
3
4
5
6
7
这里笔者也简单普及一下TimedAspect这个切面的工作原理,在springboot进行自动装配的时候扫描到TimedAspect,该切面会针对所有所有带有Timed注解的bean的方法做一个环绕增强,在连接点前后记录耗时并通过Timer记录耗时到计时器中:
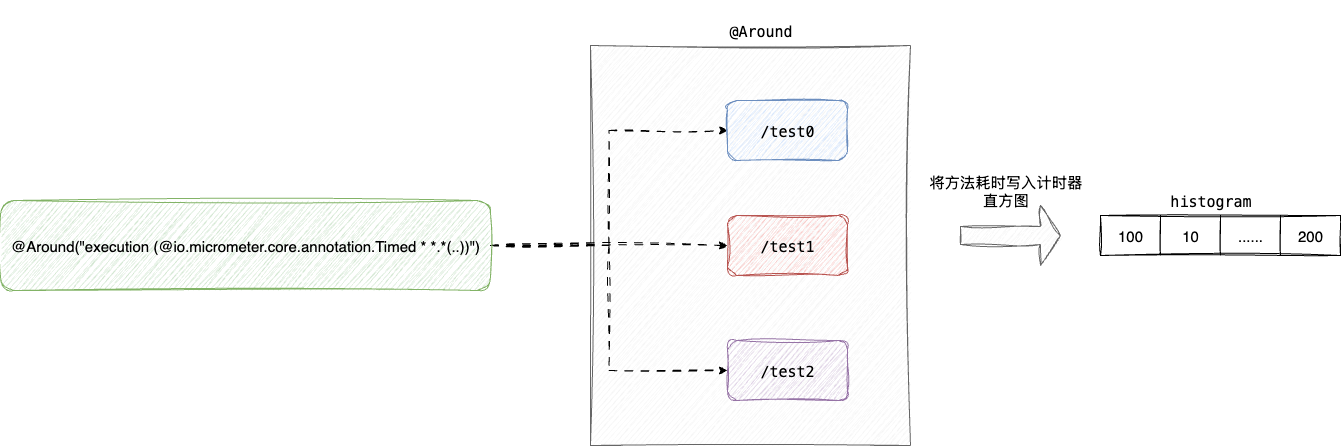
对应的TimedAspect的切点实现timedMethod如下:
 @Around("execution (@io.micrometer.core.annotation.Timed * *.*(..))")
    public Object timedMethod(ProceedingJoinPoint pjp) throws Throwable {
        Method method = ((MethodSignature) pjp.getSignature()).getMethod();
        Timed timed = method.getAnnotation(Timed.class);
        //通过注解获取方法的元信息
        if (timed == null) {
            method = pjp.getTarget().getClass().getMethod(method.getName(), method.getParameterTypes());
            timed = method.getAnnotation(Timed.class);
        }

        final String metricName = timed.value().isEmpty() ? DEFAULT_METRIC_NAME : timed.value();
        //启动计时器
        Timer.Sample sample = Timer.start(registry);
        String exceptionClass = "none";

        try {
        //调用方法
            return pjp.proceed();
        } catch (Exception ex) {
          //......
        } finally {
            try {
							//记录方法耗时
                sample.stop(Timer.builder(metricName)
                        .description(timed.description().isEmpty() ? null : timed.description())
                        .tags(timed.extraTags())
                        .tags(EXCEPTION_TAG, exceptionClass)
                        .tags(tagsBasedOnJoinPoint.apply(pjp))
                        .publishPercentileHistogram(timed.histogram())
                        .publishPercentiles(timed.percentiles().length == 0 ? null : timed.percentiles())
                        .register(registry));
            } catch (Exception e) {
                // ignoring on purpose
            }
        }
2
3
4
5
6
7
8
9
10
11
12
13
14
15
16
17
18
19
20
21
22
23
24
25
26
27
28
29
30
31
32
33
34
35
36
最后就是指标暴露和端口发布的配置:
server.port=8080
spring.application.name=web-service

# 暴露并开启所有的端点,Spring Boot Actuator会自动配置一个 URL 为 /actuator/Prometheus 的 HTTP 服务来供 Prometheus 抓取数据
management.endpoints.web.exposure.include=*
# 展示所有的健康信息
management.endpoint.health.show-details=always
# 默认/actuator/Prometheus,添加这个tag方便区分不同的工程
management.metrics.tags.application=${spring.application.name}
# Actuator 监控端点独立端口设置为 18080(与主应用端口分离)
management.server.port=18080
2
3
4
5
6
7
8
9
10
11
# 详解各大计量器工作原理
# counter(计数器)
# 应用场景
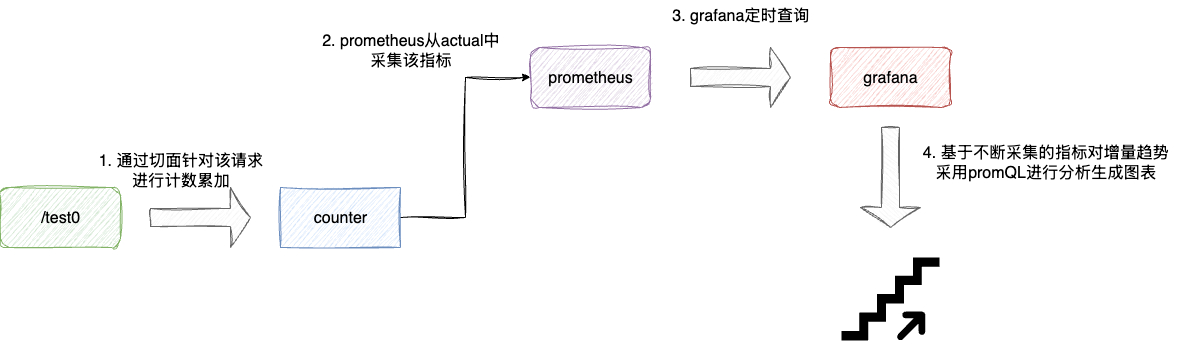
counter从名字即可了解这个计量器本质上是一个只增不减的计数器,它是有状态的(即依赖于历史的值),从使用方法上来看,它是单调递增的且上界是不可确定的,所以使用counter进行监控的指标一般是需要存在不断累加且需要针对累加的趋势进行分析的。
最典型的场景就是接口请求总数,例如我们需要针对上述的test1接口请求进行计数,从而构成时间序列存储这些数据,同时针对单位时间内这个接口增量趋势进行分析,主流的做法就是通过counter采集每一次请求,并将该指标通过prometheus交给grafana通过promQL进行即席查询分析:
# 使用示例
针对counter计数器的核心本质,即只要做到针对并发请求进行高效计数即可,其余一些分析维度的工作全部交由prometheus等数据源进行定期的采集分析即可,对应笔者项目中的应用方式就如下这个环绕切面的代码段:
- 拦截所有带有http注解的接口
- 拉取该接口方法名并生成标签
- 针对该
url的counter进行累加
@Around("execution(@org.springframework.web.bind.annotation.GetMapping * *(..)) || " +
            "execution(@org.springframework.web.bind.annotation.PostMapping * *(..)) || " +
            "execution(@org.springframework.web.bind.annotation.RequestMapping * *(..))")
    public Object countHttpRequest(ProceedingJoinPoint joinPoint) throws Throwable {
        MethodSignature signature = (MethodSignature) joinPoint.getSignature();
        Method method = signature.getMethod();
        //拉取接口方法名
        String url = extractUrl(method);
        //针对url创建切面
        Counter counter = Counter.builder("http_requests_total")
                .tag("url", url)
                .register(meterRegistry);
        //针对接口请求数进行累加
        counter.increment();


        return joinPoint.proceed();
    }
2
3
4
5
6
7
8
9
10
11
12
13
14
15
16
17
18
# 核心原理
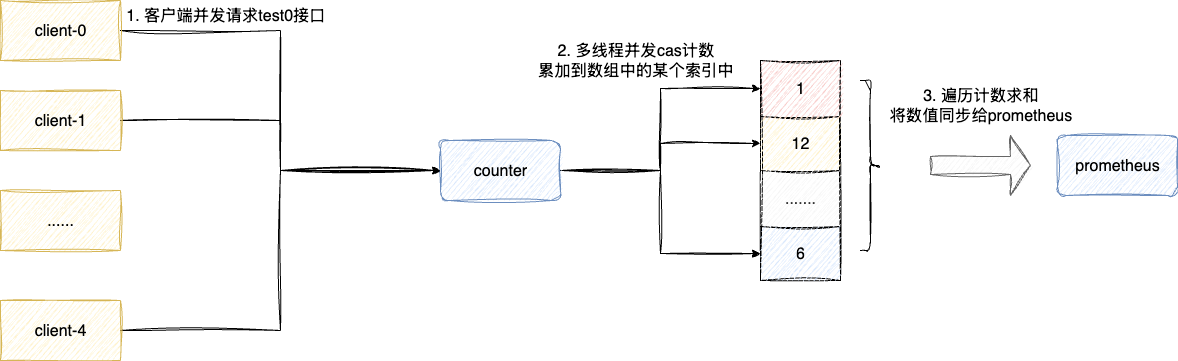
所以其实现的核心主要还是强调计数的准确性和高效性,考虑到counter在并发场景下更多是针对计数进行累加,且只有在grafana等监控系统查询时才需要获取计数值,所以针对这种写多读少且需要保证并发安全的场景。
所以counter底层采用了基于数组分散并发累加压力的计数器DoubleAdder:
对此我们可以查看counter底层的源码实现即PrometheusCounter的increment印证这一点:
public class PrometheusCounter extends AbstractMeter implements Counter {
    private DoubleAdder count = new DoubleAdder();

   //......

    @Override
    public void increment(double amount) {
        if (amount > 0)
        		//通过DoubleAdder完成并发累加
            count.add(amount);
    }

}
2
3
4
5
6
7
8
9
10
11
12
13
# guage(仪表类型)
# 应用场景
guage也是我们常用的仪表盘,和counter有所不同,guage计数器可以增减,它是无状态的,即此刻的数值与历史数值并没有依赖关系,它更常用于观察带有上下界的指标,即侧重于那些系统状态的指标:
- cpu利用率
- 内存利用率
- 网络带宽
所以针对gauge的使用理念,我们也还是通过gauge采集单位时间下的指标的数值,然后交给grafana让其通过promQL分析其增减趋势亦或者上下浮动情况以准确针对系统情况进行深入分析:

# 使用示例
类似的我们通过spring boot的registry全局注册一个guage,通过原子类进行设置值,即直接通过原子类记录当前cpu使用率,让prometheus定期采集交给grafana进行即席查询分析:
AtomicInteger cost = registry.gauge("cpu.usage", Tags.of("core-number", "0"), new AtomicInteger(0));
        //随机数模拟cpu使用率
        cost.set(RandomUtil.randomInt(100));
2
3
# 工作原理
我们注册gauge的时候通过构造函数指明底层采用AtomicInteger进行数值维护,后续我们就可以直接操作这个原子类引用完成数值维护修改:
AtomicInteger cost = registry.gauge("cpu.usage", Tags.of("core-number", "0"), new AtomicInteger(0));
为什么可以采用原子类AtomicInteger呢?查看gauge底层实现,从源码可以看到该参数为泛型T只需继承Number类,保证获取数值时可以通过doubleValue方法返回值即可。
而AtomicInteger恰好继承Number类且保证并发计数安全,所以才适用于作为gauge底层的计数器:
@Nullable
    public <T extends Number> T gauge(String name, Iterable<Tag> tags, T number) {

        return gauge(name, tags, number, Number::doubleValue);
    }
2
3
4
5
结合这个泛型构造,我们也可以直接采用LongAdder作为gauge底层的计量器,由于其底层采用数组三列并发累加压力,所以更适用于作为监控计数的指标:
LongAdder gauge = registry.gauge("cpu.usage", Tags.of("core-number", "0"), new LongAdder());
# timer
# 应用场景
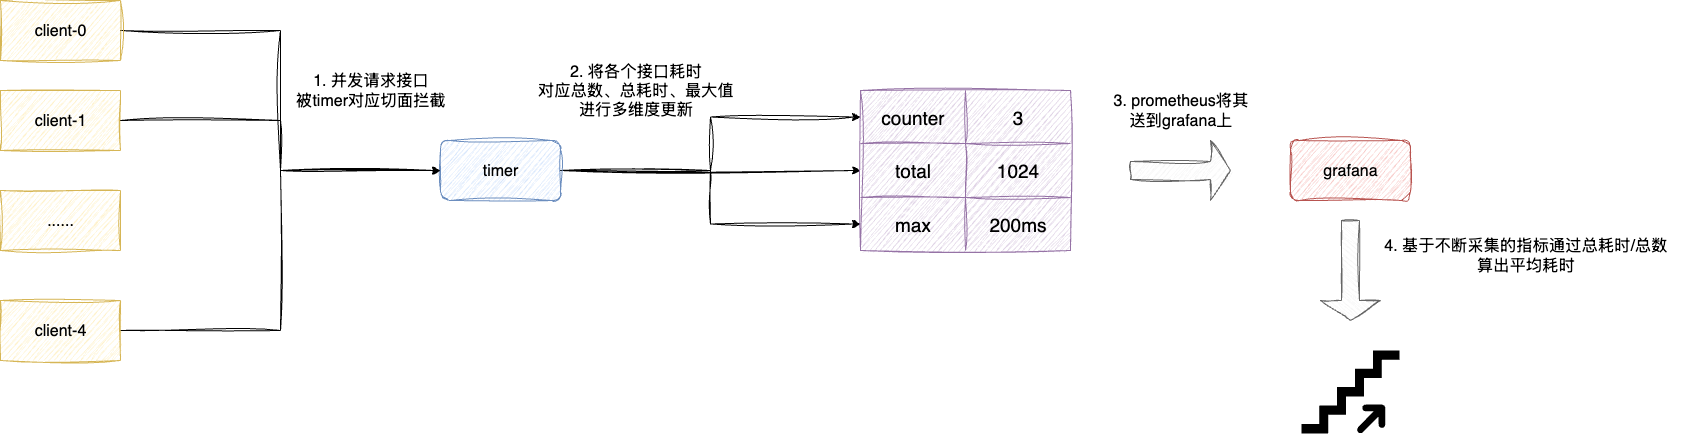
timer计时器主要是跟踪大量短耗时的事件进行多维度的采集,通过计时器统计某个事件耗时时,其底层会维护针对此事件:
- 事件总数:采用
LongAdder维护 - 事件总耗时:同样采用
LongAdder维护 - 事件耗时最大值:通过
TimeWindowMax时间窗口进行维护
后续我们就可以通过prometheus构成时间序列将其交给grafana,此时我们就可以根据这些指标计算:
- 当前一段时间请求总数
- 当前一段时间的平均耗时
- 当前一段时间的最大值
# 使用示例
对应的用法上文已经介绍过,我们可以自定义注册一个timer,后续直接用这个timer的record方法记录耗时:
 @Autowired
    private MeterRegistry registry;
    private Timer timer;


    @PostConstruct
    private void init() {
        //名称设置为http.timer,标签设置为uri为/hello,选用合适的名称辅助开发推断理解
        timer = Timer
                .builder("http.timer")
                .publishPercentiles(0.5, 0.95) //发布百分位数区间
                .description("接口请求耗时统计") // 指标的描述
                .tags("url", "/test0") // url标签指明为hello
                .register(registry);


    }
2
3
4
5
6
7
8
9
10
11
12
13
14
15
16
17
18
耗时记录使用示例如下:
@GetMapping("/test0")
    public String function() {
        int sleepTime = RandomUtil.randomInt(200);
        ThreadUtil.sleep(sleepTime);
        timer.record(sleepTime, TimeUnit.MILLISECONDS);
        return "test0";
    }
2
3
4
5
6
7
# 工作原理
关于timer针对上述三个度量指标,从上文表述我们就知道大体就是通过:
count记录请求总数totalTime记录总耗时max窗口工具类维护最大耗时
对应的我们也可以通过timer底层实现PrometheusTimer印证这一点:
public class PrometheusTimer extends AbstractTimer {
		//......
		//记录请求总数
    private final LongAdder count = new LongAdder();
    //记录总耗时
    private final LongAdder totalTime = new LongAdder();
    //窗口内记录最大耗时
    private final TimeWindowMax max;

	//......
}
2
3
4
5
6
7
8
9
10
11
当我们的通过timer记录本次接口耗时,record方法本质做的是:
count原子自增请求总数totalTime原子累加记录总耗时- max通过一个环形缓冲区维护
1min以内请求的最大值
对应第一点和第二点都是简单的原子累加操作,这里就不多做赘述了,我们着重的说明一下最大耗时这个操作的底层工作原理,这个记录最大值的工具类TimeWindowMax本质上是用一个唤醒缓冲区实现(本质上就是一个数组),数组3个元素分别代表:
- 当前
1min内的最大值 - 当前
2min内的最大值 - 当前
3min内的最大值:
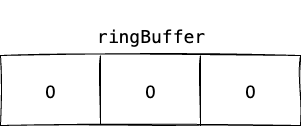
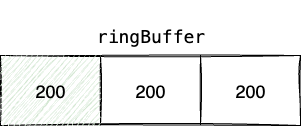
我们都知道这个max计数器记录的都是当前1min内耗时最大的值,假设我们当前这分钟的最大值为200ms,那么ringbuffer[0]记录的最大值就是200ms。
注意:TimeWindowMax维护最大值是会遍历数组中每个元素进行比对,然后将最大值写入:
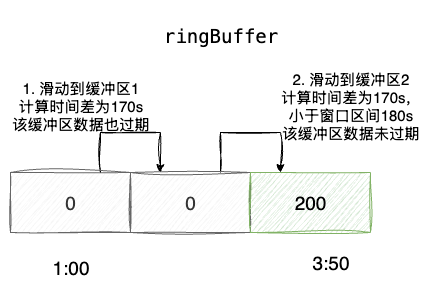
一旦ringbuffer[0]使用时间超过1min,例如当前时间是3:50距离ringbuffer[0]使用开始时间1:00已经超过170s,TimeWindowMax就会执行如下步骤:
- 计算时间差为170,已经超过
ringbuffer[0]的窗口区间(当前1min内的最大值),所以将该原子类重置为0,指针移动到ringbuffer[1] ringbuffer[1]代表当前2min内的最大值,170s也大于其窗口时间区间120s,所以这个窗口也过期直接重置为0,指针移动到ringbuffer[1]ringbuffer[2]代表当前3min内的数组,对应窗口活跃保质期为180s大于170s,所以没过期
所以ringbuffer[2]这个窗口后续作为当前1min内的窗口,其他窗口循环重置后循环复用作为当前2min、3min内的窗口,这就是这个算法的巧妙所在:
对应的我们也可以通过源码印证这一点,可以看到timer底层调用record入口来自AbstractTimer,这个抽象类对外暴露recordNonNegative这个抽象方法,对应也就是我们的工具类PrometheusTimer的recordNonNegative方法:
@Override
    public final void record(long amount, TimeUnit unit) {
        if (amount >= 0) {
           	//......
           	//记录请求总数、耗时、最大值
            recordNonNegative(amount, unit);

           	//......
        }
    }
2
3
4
5
6
7
8
9
10
查看PrometheusTimer的recordNonNegative可以发现他做了如下三件事:
counter自增维护请求总数totalTime累加计算总耗时max.record记录最大耗时
@Override
    protected void recordNonNegative(long amount, TimeUnit unit) {
    			//累计请求总数
        count.increment();
        long nanoAmount = TimeUnit.NANOSECONDS.convert(amount, unit);
        //累加总耗时
        totalTime.add(nanoAmount);
        //维护最大值
        max.record(nanoAmount, TimeUnit.NANOSECONDS);

       //......
    }
2
3
4
5
6
7
8
9
10
11
12
关于请求和耗时累计逻辑比较直观,笔者就不多做介绍了,步入max的record就可以看到核心所在:
- 调用
rotate执行我们上述图解的窗口滑动算法整理三个窗口 - 基于必要整理重置后的窗口数组和当前耗时进行比对,维护最新的最大值
public void record(double sample, TimeUnit timeUnit) {
			//窗口旋转维护
        rotate();
        //遍历各个缓冲区并维护最大值
        final long sampleNanos = (long) TimeUtils.convert(sample, timeUnit, TimeUnit.NANOSECONDS);
        for (AtomicLong max : ringBuffer) {
            updateMax(max, sampleNanos);
        }
    }
2
3
4
5
6
7
8
9
查看rotate源码中可以看到,rotate就是实现窗口旋转的核心,其内部做了如下几件事:
- 它会获取当前时间距离上次窗口旋转时间,判断是否超期,若超过60s则说明存在过期窗口需要滑动窗口,进入步骤2
- cas上锁保证只有一个线程执行此操作
- 遍历各个元素,通过距离上次旋转时间
timeSinceLastRotateMillis不断循环减去60s和durationBetweenRotatesMillis比较以做到
1. 第1次循环减去0个60,即查看第一个窗口得到的timeSinceLastRotateMillis是否超过60,若超过则说明过期
2. 第2次循环减去1个60,即查看第2个窗口得到的timeSinceLastRotateMillis-60s是否超过60(即是否超过2min),若超过则说明过期
3. ......
2
3
4
- 完成窗口重置和滑动后,将本次的耗时分别于各个窗口进行比对,如果比窗口值大则直接写入,这个算法比较巧妙,读者可以结合笔者的说明自行理解:
private void rotate() {
			//计算上次旋转窗口的时间
        long timeSinceLastRotateMillis = clock.wallTime() - lastRotateTimestampMillis;
        //如果没有超过60s则返回
        if (timeSinceLastRotateMillis < durationBetweenRotatesMillis) {
            // Need to wait more for next rotation.
            return;
        }
				//上个自旋锁保证并发互斥,进行窗口滑动操作
        if (!rotatingUpdater.compareAndSet(this, 0, 1)) {
            // Being rotated by other thread already.
            return;
        }

        try {
            int iterations = 0;
            synchronized (this) {
                do {
                	//重置当前窗口
                    ringBuffer[currentBucket].set(0);
                    //移动到下一个窗口,如果超过上界则回到索引0位置
                    if (++currentBucket >= ringBuffer.length) {
                        currentBucket = 0;
                    }
                    //减去60s查看这个窗口是否超过区间,因为是do while循环,所以多次循环就可以做到查看60s、120s(循环1次减去一个60和60进行比对)、180s(循环2次减去2个60和60进行比对)对应的3个缓冲区是否过期
                    timeSinceLastRotateMillis -= durationBetweenRotatesMillis;
                    //上次滑动窗口时间加上60s,即代表这个窗口区间理论上的旋转窗口时间
                    lastRotateTimestampMillis += durationBetweenRotatesMillis;
                    //
                } while (timeSinceLastRotateMillis >= durationBetweenRotatesMillis && ++iterations < ringBuffer.length);
            }
        } finally {
            rotating = 0;
        }
    }
2
3
4
5
6
7
8
9
10
11
12
13
14
15
16
17
18
19
20
21
22
23
24
25
26
27
28
29
30
31
32
33
34
35
36
37
# 详解promQL
# promQL 指标的基本构成说明
在正式介绍promQL表达式之前,我们需要先针对Prometheus风格的指标构成进行一下必要的对齐:
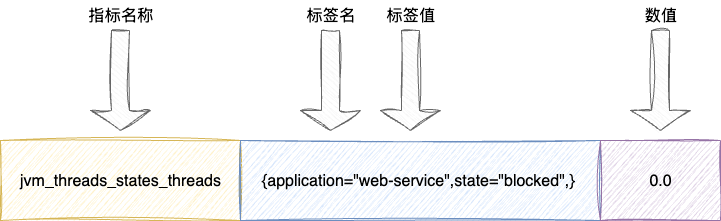
#号部分为必要的描述和注释说明,如下注释分别对应我们自定义的指标描述和Prometheus的计量器说明(本例则是guage)jvm_threads_states_threads为指标名称- 后续
{}部分则是针对jvm_threads_states_threads各个不同维度区分的标签
# HELP jvm_threads_states_threads The current number of threads having NEW state
# TYPE jvm_threads_states_threads gauge
jvm_threads_states_threads{application="web-service",state="blocked",} 0.0
jvm_threads_states_threads{application="web-service",state="waiting",} 23.0
jvm_threads_states_threads{application="web-service",state="runnable",} 11.0
jvm_threads_states_threads{application="web-service",state="timed-waiting",} 4.0
jvm_threads_states_threads{application="web-service",state="new",} 0.0
jvm_threads_states_threads{application="web-service",state="terminated",} 0.0
2
3
4
5
6
7
8
我们以jvm_threads_states_threads{application="web-service",state="blocked",} 0.0为例说明一下,这是一个典型的Prometheus风格的指标值,通过标签名限定当前指标的语义,例如jvm_threads_states_threads就代表不同状态的线程数,同时通过标签声明指标的维度,以该指标为例,则是通过应用名称application和状态state区分单指标下不同维度的数值,最后就是指标的数值:
# promQL常见表达式
# promQL核心概念
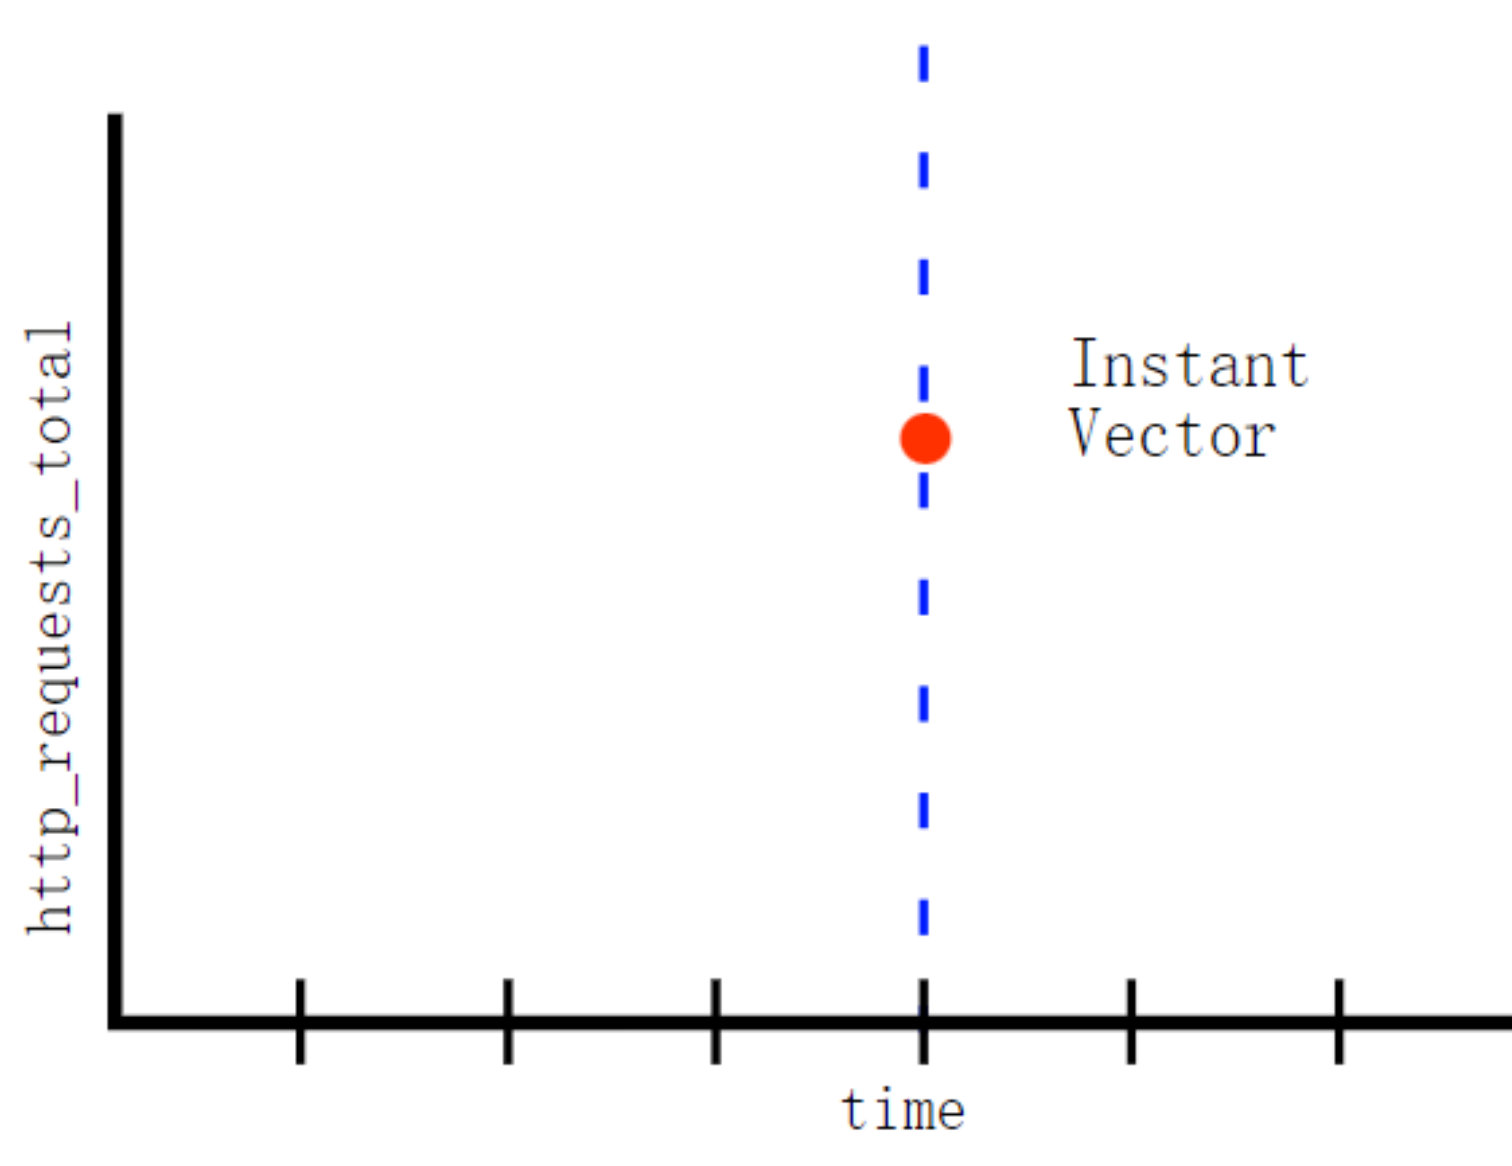
瞬时向量(Instant vector):一组时间序列上,每个时间上只有一个样本,他们共享相同的时间戳,即表达式的返回值只会包含该时间中的最新的样本值:
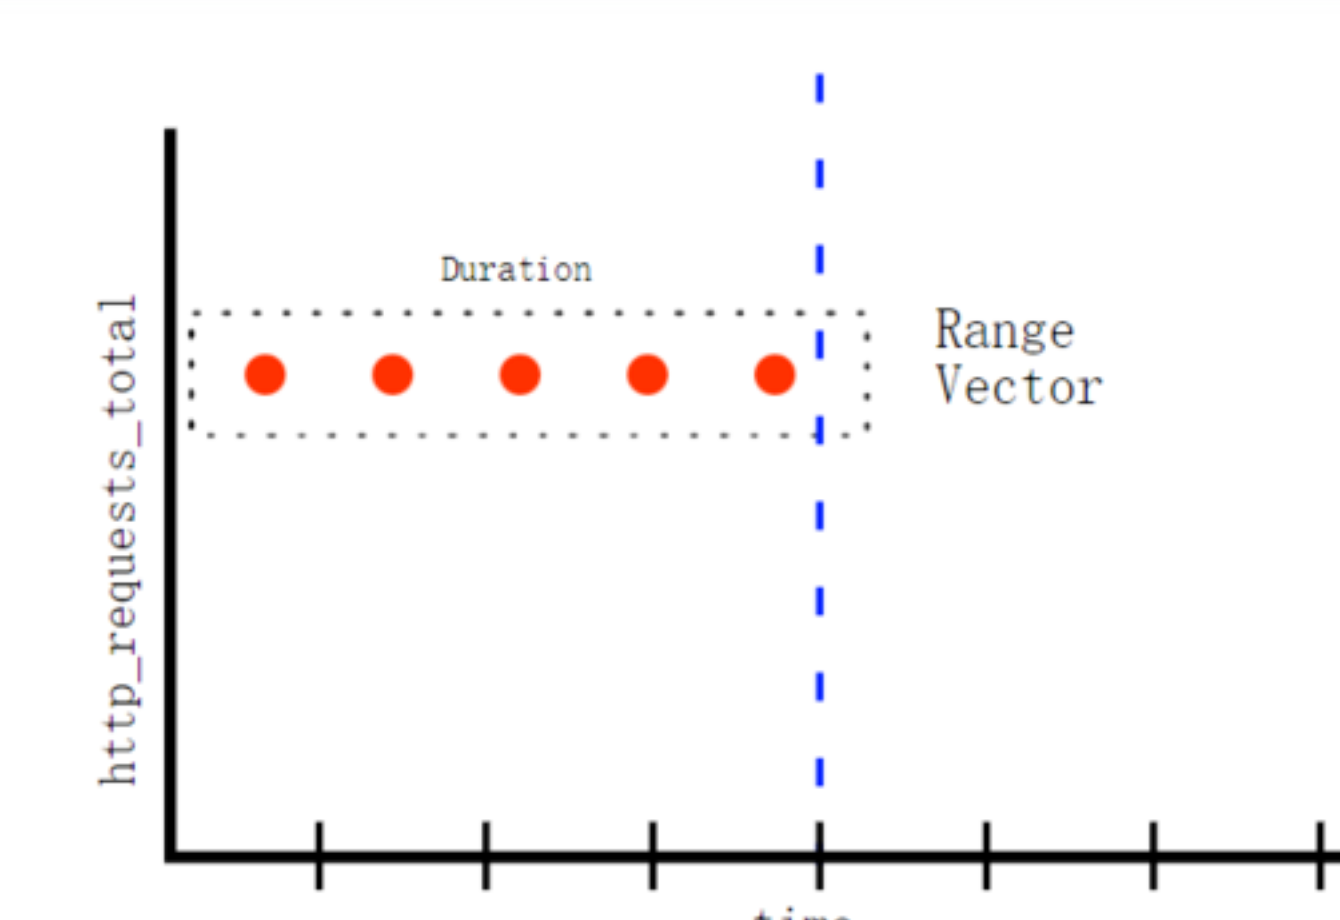
区间向量(Range vector):即一个时间范围内的每个时间序列包含一段时间范围内的样本数据:
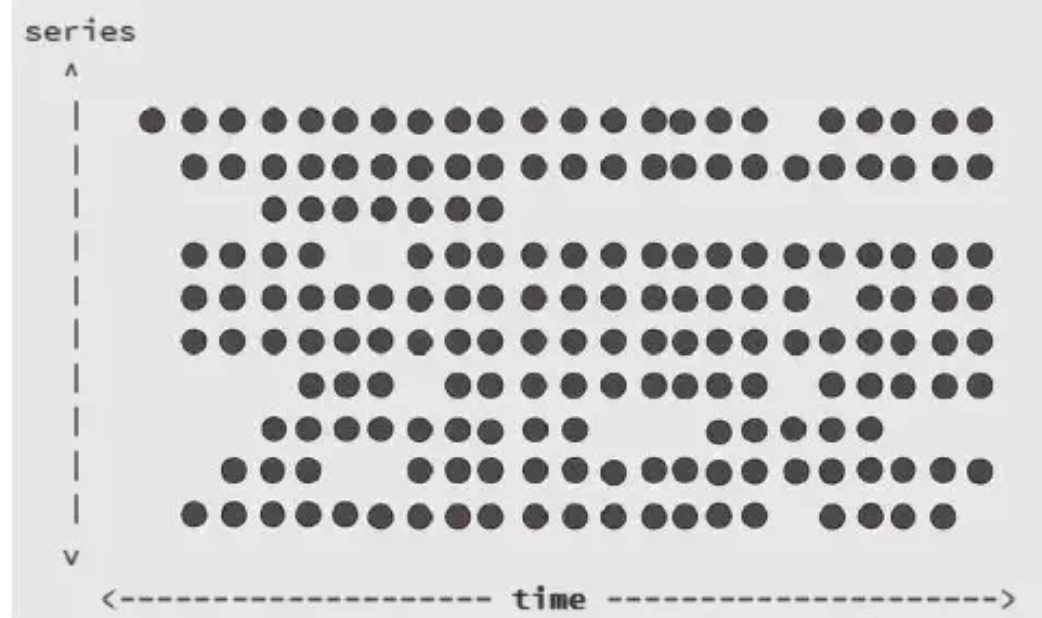
时间向量:以时间为横坐标,序列作为纵坐标构成一组反应状态变化的向量图,该向量图通过定时周期性采集,随着时间的流逝生成一个离散的样本数据序列。
通过指标名称结合标签生成多条趋势线条,也就是多条时间序列,而序列也就是我们常说的vector:
# 匹配表达式
有了上述对于计量器的基本介绍,我们在针对promQL中几个比较常见的表达式和函数展开介绍,promQL中也存在着逻辑表达式,这其中涉及匹配表达式和逻辑表达式。
我们先来说说匹配表达式:
- 完全匹配:与字符串完全匹配即
= - 不匹配:与字符串不匹配即
!= - 正则匹配:与字符串正则匹配=~
- 正则反向过滤:与字符串正则不匹配
!~
它可以针对多维度的指标进行筛选和检索,例如我们从spring actuator上看到jvm线程各个状态的指标及其对应的线程数:
# HELP jvm_threads_states_threads The current number of threads having NEW state
# TYPE jvm_threads_states_threads gauge
jvm_threads_states_threads{application="web-service",state="blocked",} 0.0
jvm_threads_states_threads{application="web-service",state="waiting",} 23.0
jvm_threads_states_threads{application="web-service",state="runnable",} 11.0
jvm_threads_states_threads{application="web-service",state="timed-waiting",} 4.0
jvm_threads_states_threads{application="web-service",state="new",} 0.0
jvm_threads_states_threads{application="web-service",state="terminated",} 0.0
2
3
4
5
6
7
8
默认情况下,它在Prometheus的console渲染显示如下:
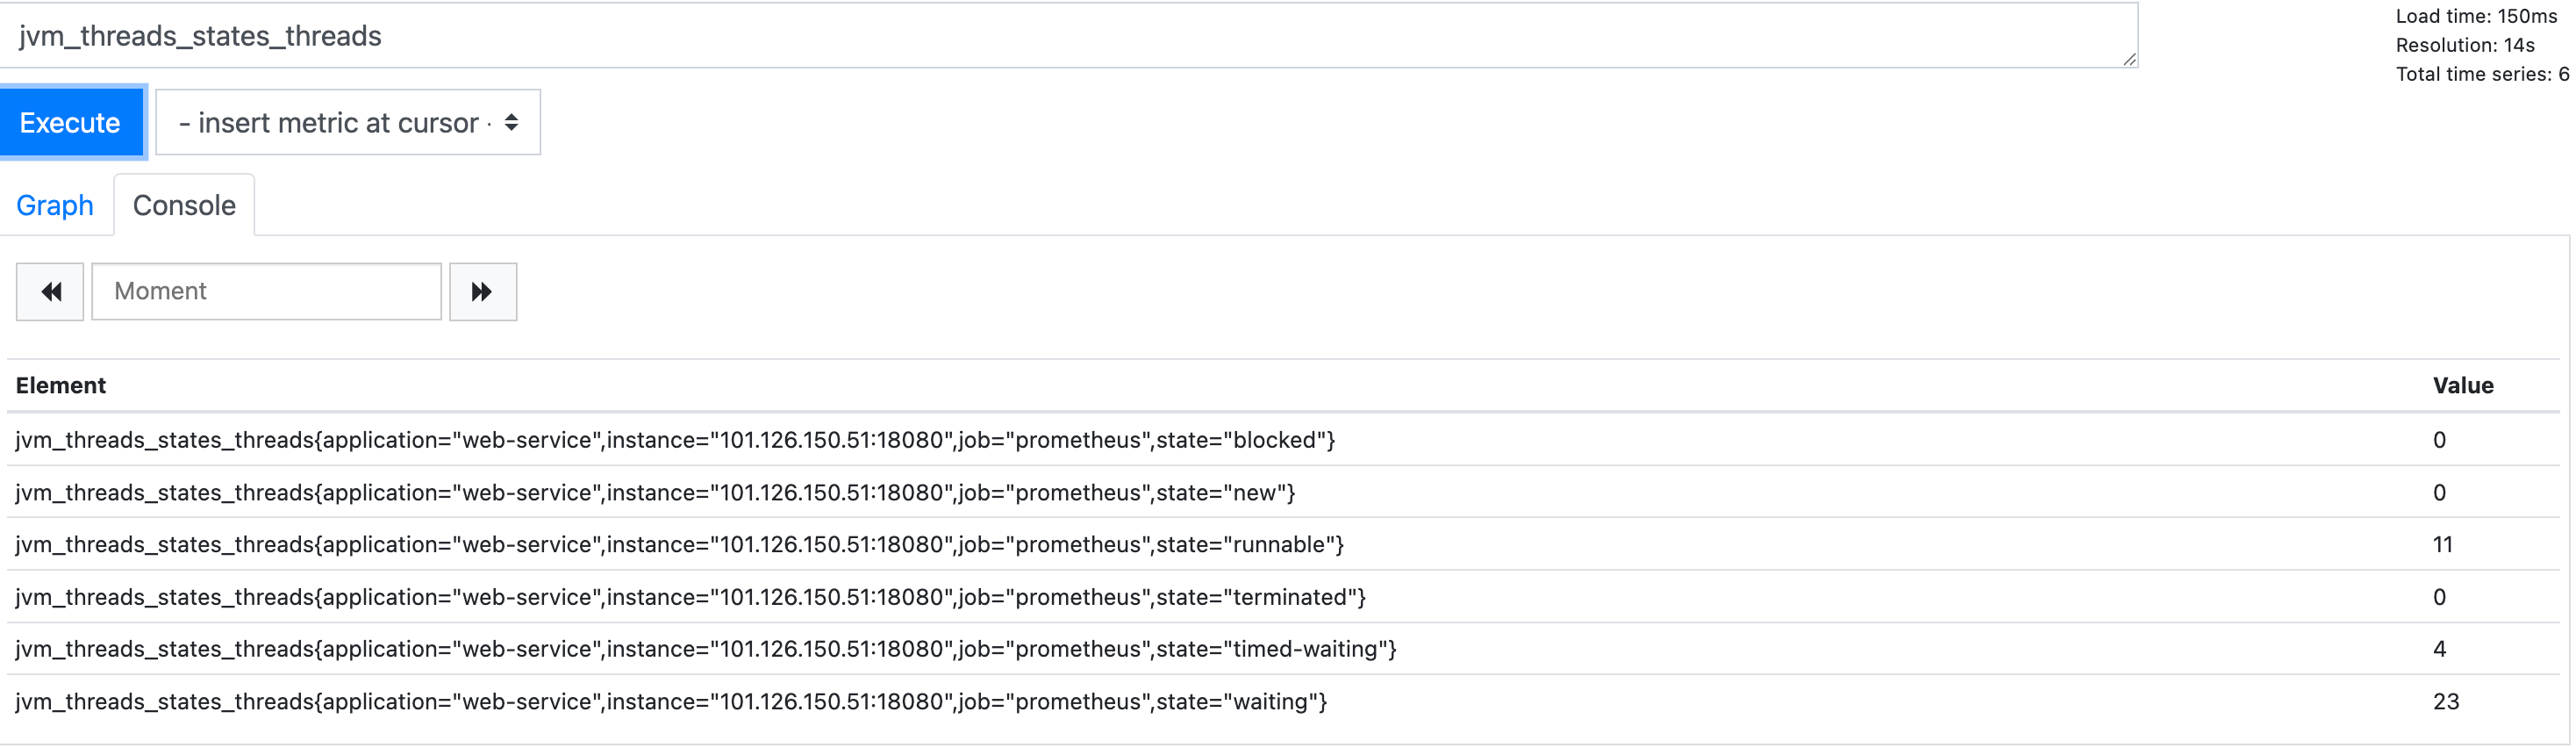
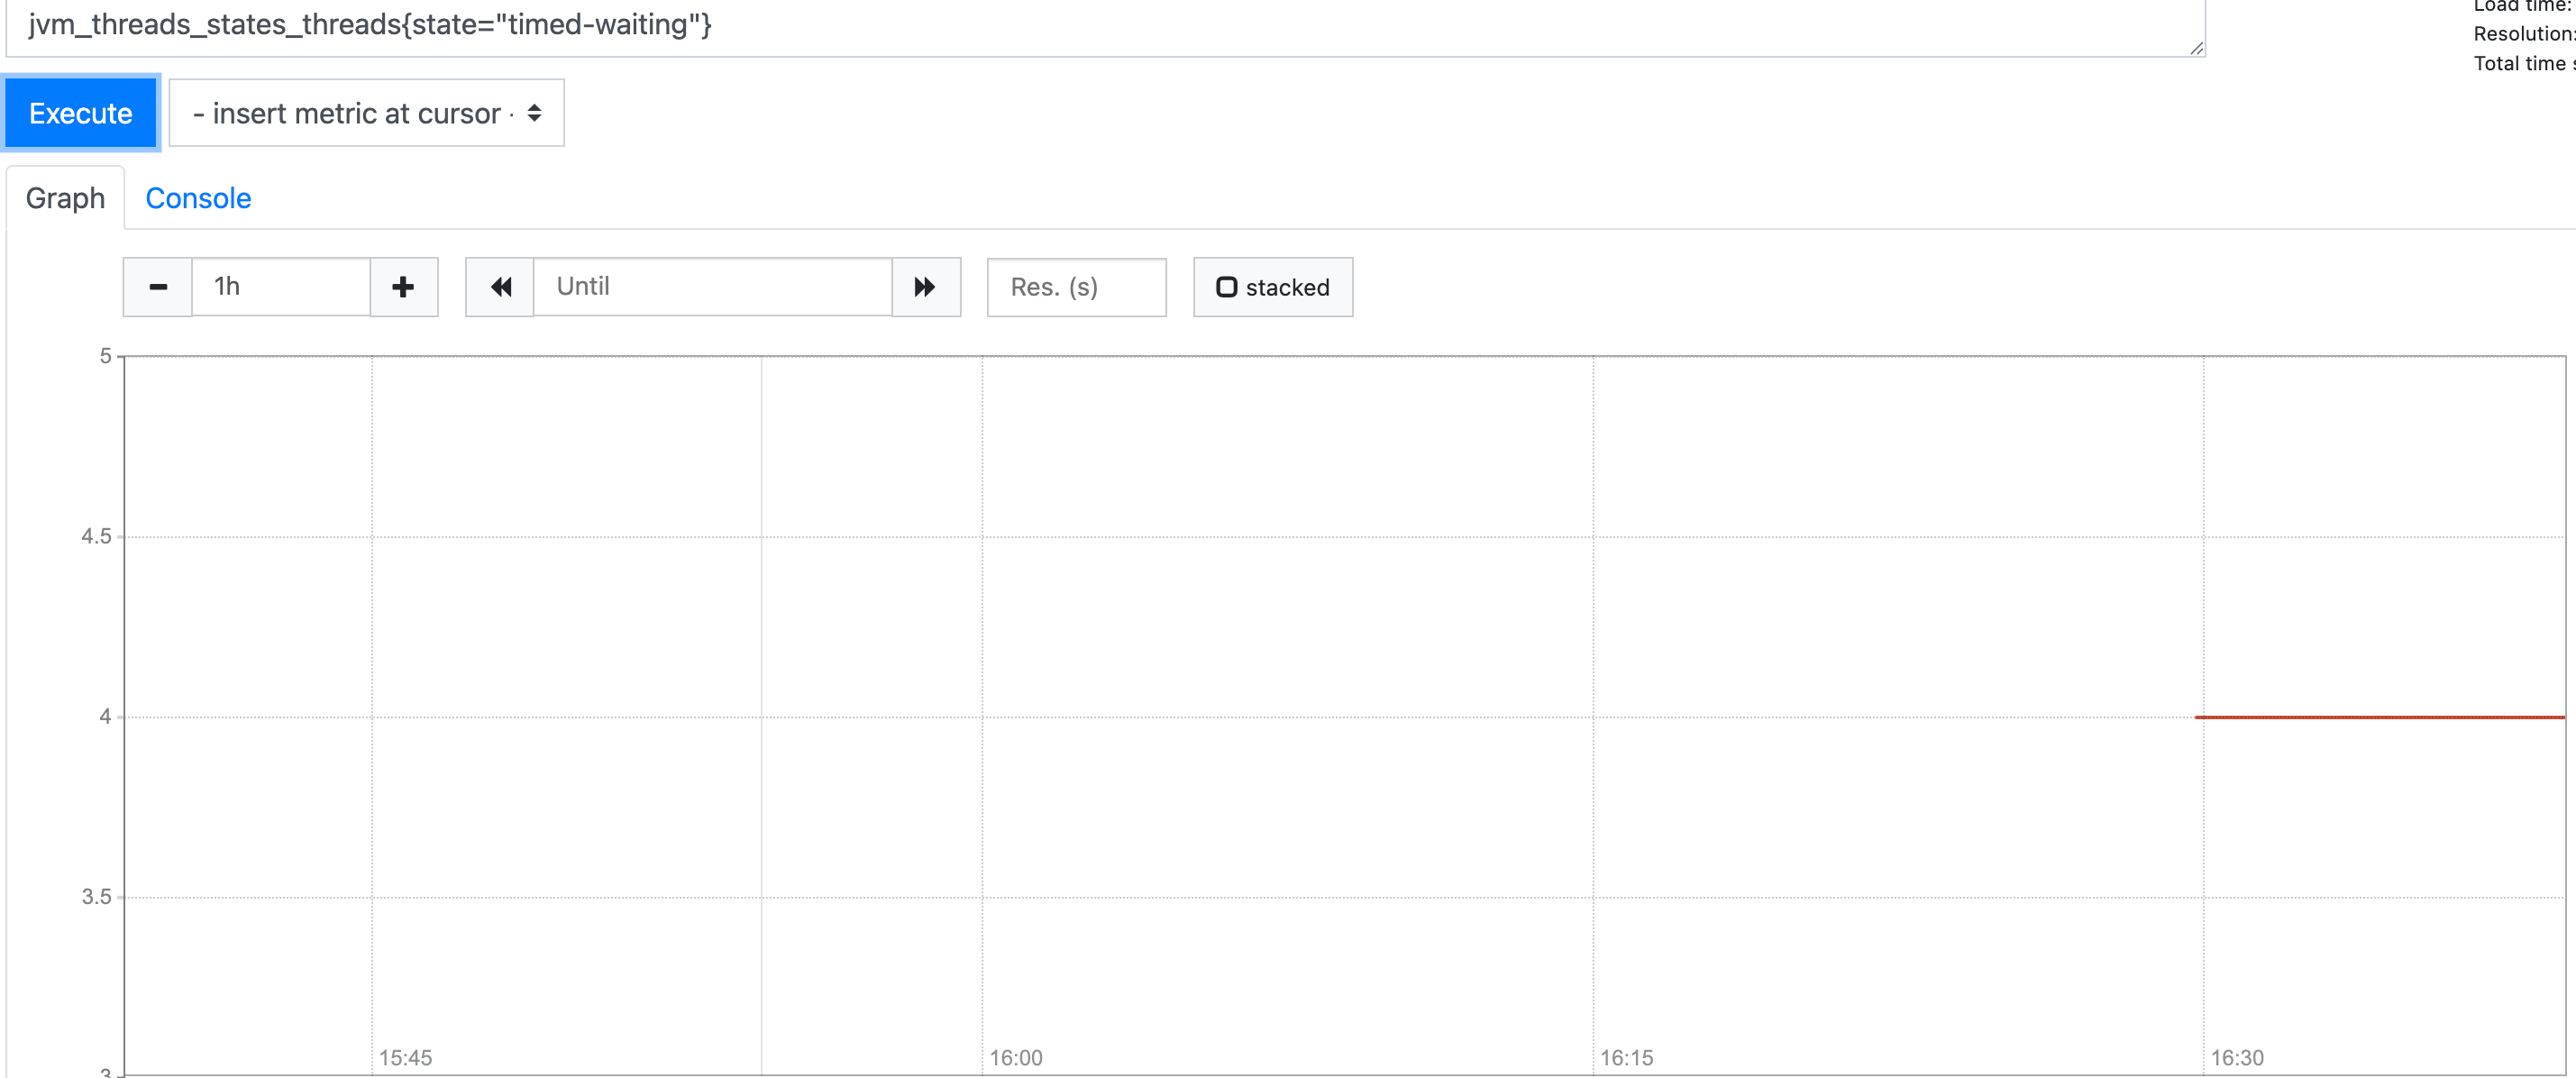
如果我们希望只希望查看timed-waiting的线程数,此时我们就可以通过标签结合相等匹配器实现,对应的表达式为:
jvm_threads_states_threads{state="timed-waiting"}
此时视图就会准确过滤筛选出状态为timed-waiting的线程数:
同理过滤出状态非timed-waiting的表达式为:
jvm_threads_states_threads{state!="timed-waiting"}
同理,如果我们希望匹配r开头的表达式则是:
jvm_threads_states_threads{state=~"r.*"}
# 逻辑表达式
promQL也存在和各种逻辑运算的表达式匹配:
and:即两个序列即上述的vector进行与运算产生新的集合,只有两个即可都存在的元素才会显示or:只要左右任何一边的vector表达式计算为真,就显示左右vector的所有元素unless:即左右两边的vector进行或运算构成新的并集,然后通过unless右边的vector进行过滤,将右边vector存在的元素移除
对此我们不妨距离说明,关于逻辑表达式我们以一个针对http请求数计算的指标http_requests_total为例进行演示,对应指标如下:
# HELP http_requests_total
# TYPE http_requests_total counter
http_requests_total{application="web-service",url="/test2",} 1.0
http_requests_total{application="web-service",url="/test0",} 2.0
http_requests_total{application="web-service",url="/test1",} 340.0
2
3
4
5
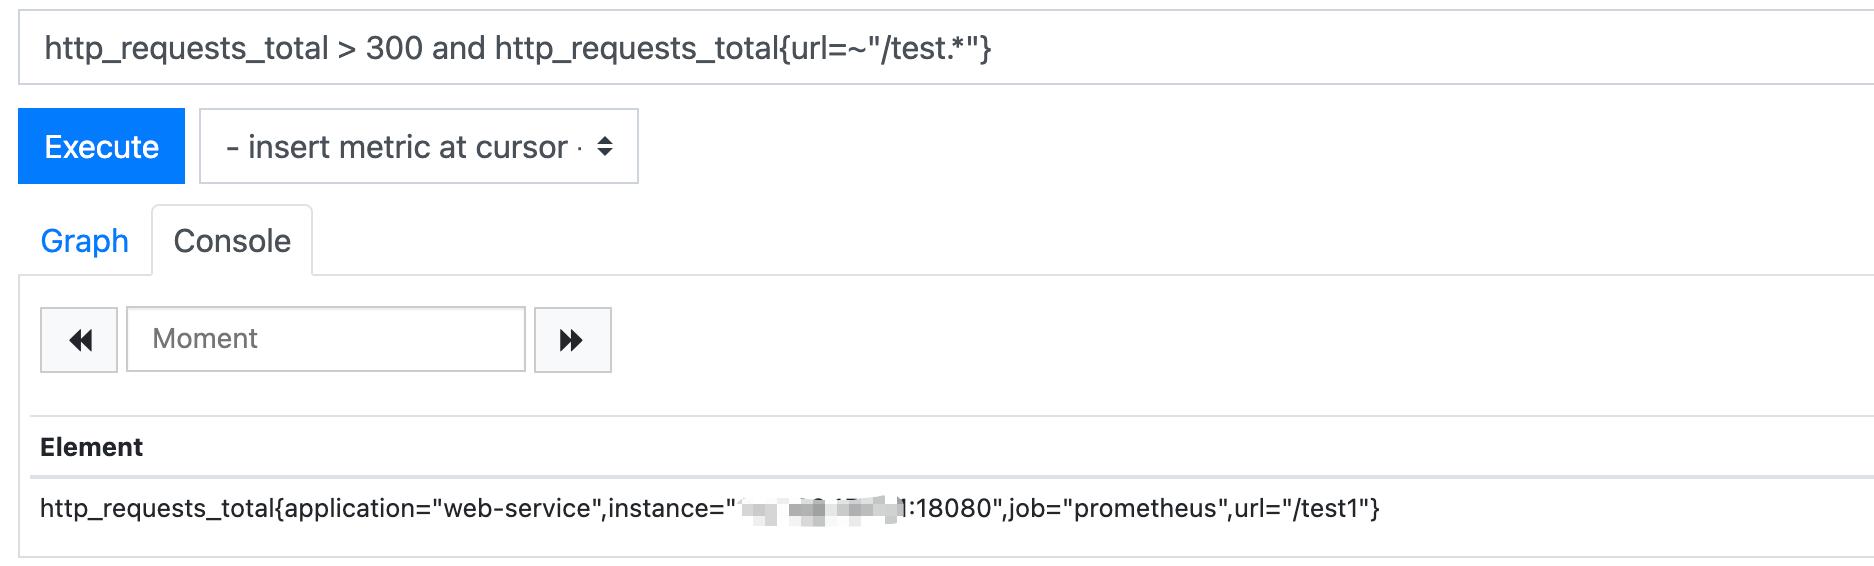
如果我们希望查询请求数大于300且映射以test开头,在promQL表达式则是采用and,对应的表达式如下,最终的输出结果也是:
http_requests_total > 300 and http_requests_total{url=~"/test.*"}
最终输出的也是test1:
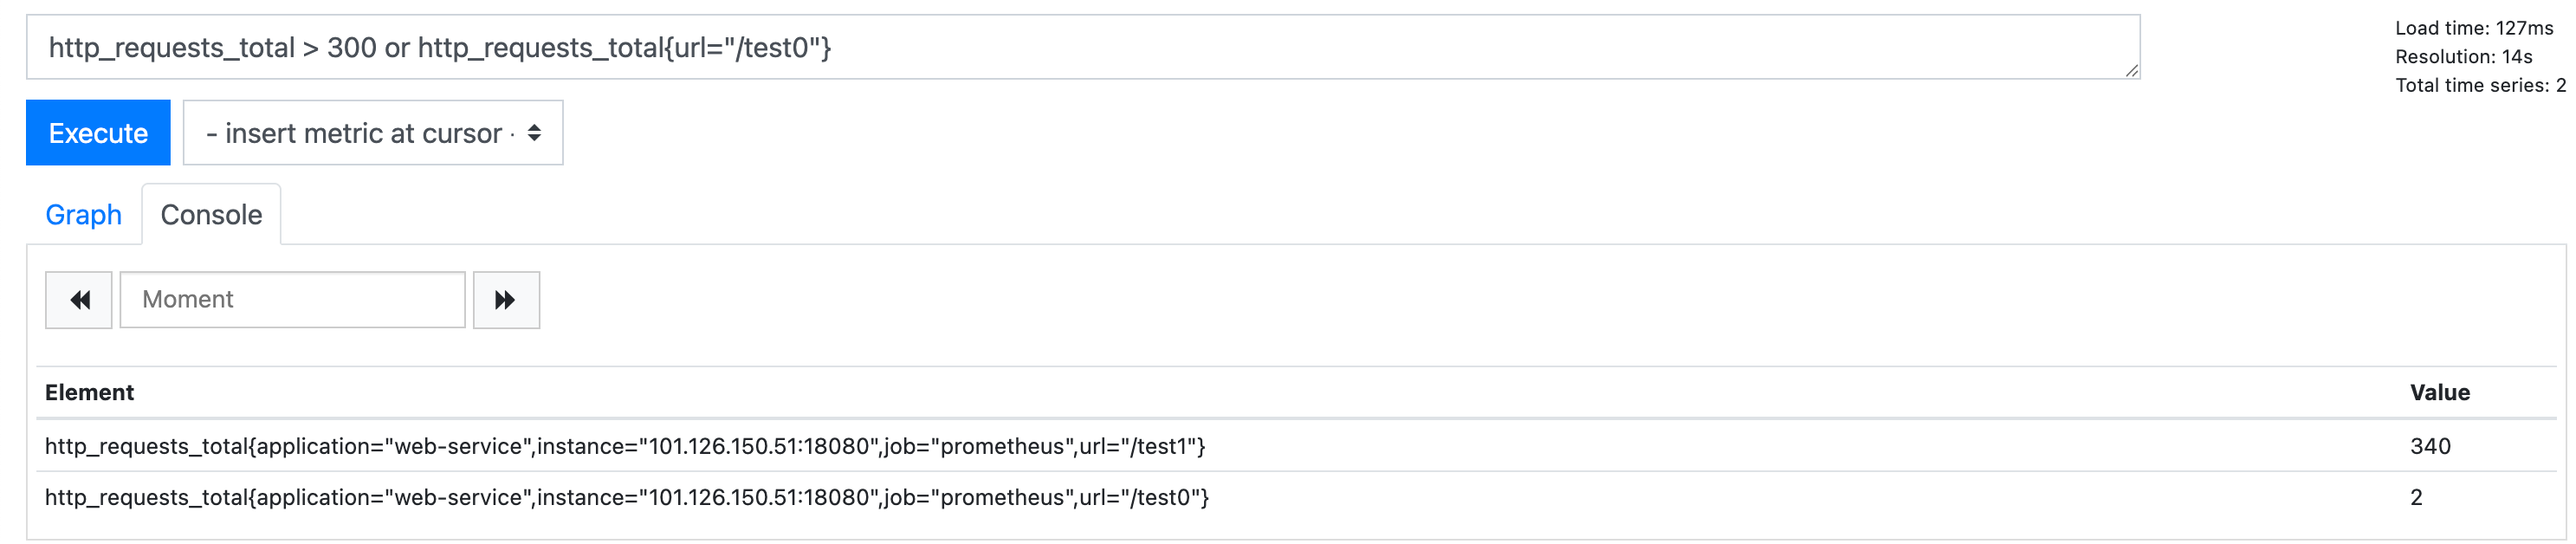
同理如果希望查询请求数大于300或者映射为test0,则表达式如下:
http_requests_total > 300 or http_requests_total{url="/test0"}
需要注意的是promQL表达式中的or并非短路运算,即表达式为真的情况下,左右vector都会输出,也就是大于请求数大于300和test0映射都会输出:
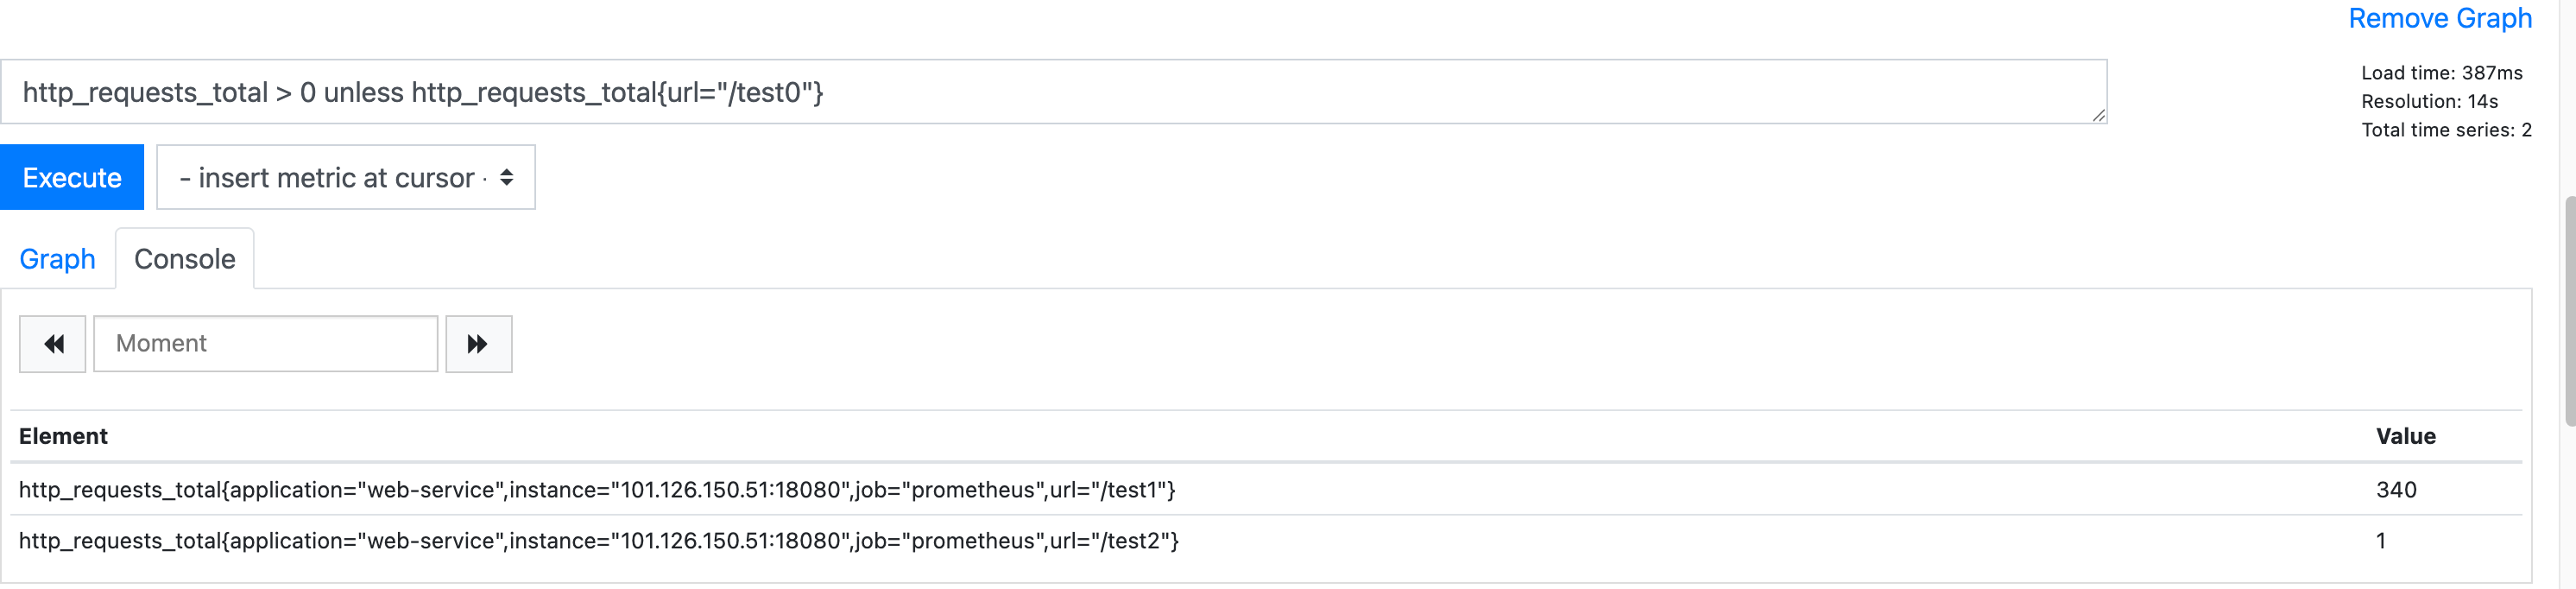
最后则是unless,相较于常规的逻辑表达式,该逻辑表达式的执行逻辑为将左右或运算得到交集后,结果交由右边过滤得出目标标签数据,例如我们需要查询出请求总数大于0但要排除test0,对应的表达式就如下所示:
http_requests_total > 0 unless http_requests_total{url="/test0"}
对应的推算过程为:
- 将请求数大于0和
/test0的指标通过或运算构成新集合即/test0、/test1、/test2 - 基于右边
vector将非test0的元素过滤,最终得到/test1和/test2:
# 常见函数
# 聚合函数
接下来就是介绍一些比较常见的函数,和常见的sql语句一样,promQL也有如下常见内置函数:
sum:指标求和avg:指标平均数max:指标最大值min:指标最小值
我们还是以http_requests_total为例,对应不同接口的请求总数如下:
# HELP http_requests_total
# TYPE http_requests_total counter
http_requests_total{application="web-service",url="/test2",} 1.0
http_requests_total{application="web-service",url="/test0",} 2.0
http_requests_total{application="web-service",url="/test1",} 340.0
2
3
4
5
假设我们希望定位出http_requests_total的最大值,对应的就可以使用max(http_requests_total),其余函数同理,这些函数本质上就是基于当前指标通过函数聚合计算,比较简单笔者就不多做演示了。
# 时间样本分析常用函数
对于监控来说,我们更希望看到监控指标的整体趋势,观察系统的动态以便进行针对性的调优,这其中常见的函数有:
max_over_time:指定一段时间的最大值avg_over_time:指定一段时间的平均值min_over_time:指定一段时间的最小值rate:计算指定时间范围内平均每秒增长率delta:观察系统一段时间指标上下浮动差
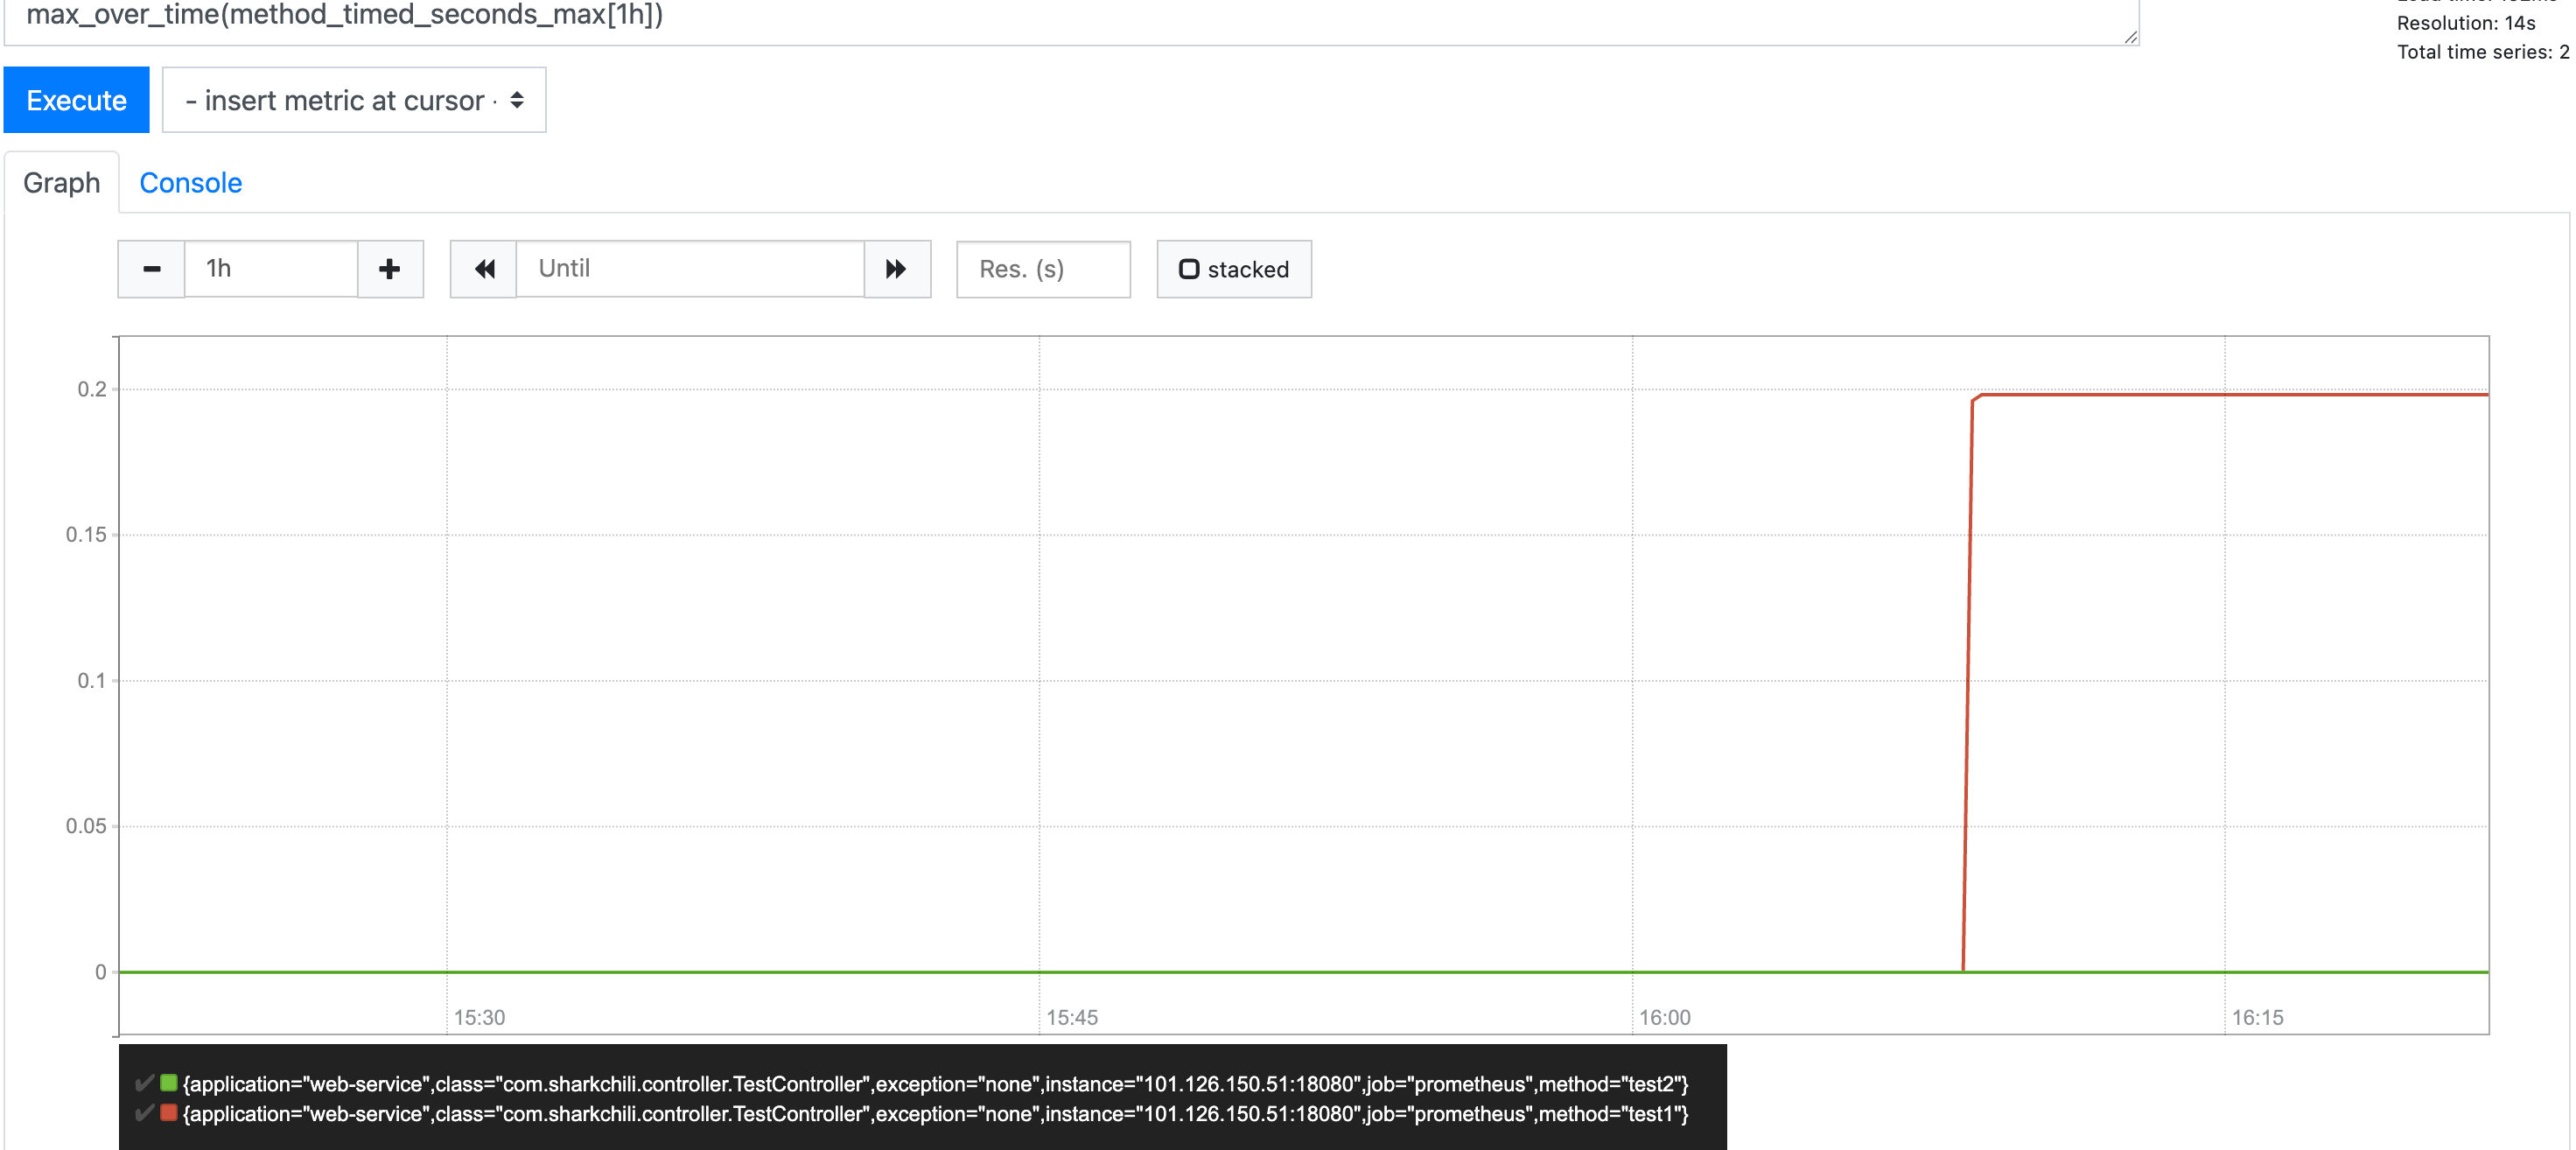
假设我们通过timer维护一份基于时间维度的各个接口耗时、请求总数、最大值等信息:
# HELP method_timed_seconds
# TYPE method_timed_seconds summary
method_timed_seconds_count{application="web-service",class="com.sharkchili.controller.TestController",exception="none",method="test2",} 1.0
method_timed_seconds_sum{application="web-service",class="com.sharkchili.controller.TestController",exception="none",method="test2",} 0.032457149
method_timed_seconds_count{application="web-service",class="com.sharkchili.controller.TestController",exception="none",method="test1",} 840.0
method_timed_seconds_sum{application="web-service",class="com.sharkchili.controller.TestController",exception="none",method="test1",} 84.248322878
# HELP method_timed_seconds_max
# TYPE method_timed_seconds_max gauge
method_timed_seconds_max{application="web-service",class="com.sharkchili.controller.TestController",exception="none",method="test2",} 0.0
method_timed_seconds_max{application="web-service",class="com.sharkchili.controller.TestController",exception="none",method="test1",} 0.198215155
2
3
4
5
6
7
8
9
10
若我们希望查看过去1h耗时的最大值分布,对应表达式为 max_over_time(method_timed_seconds_max[1h]),对应输出结果如下,其余平均值、最小值也是同理。
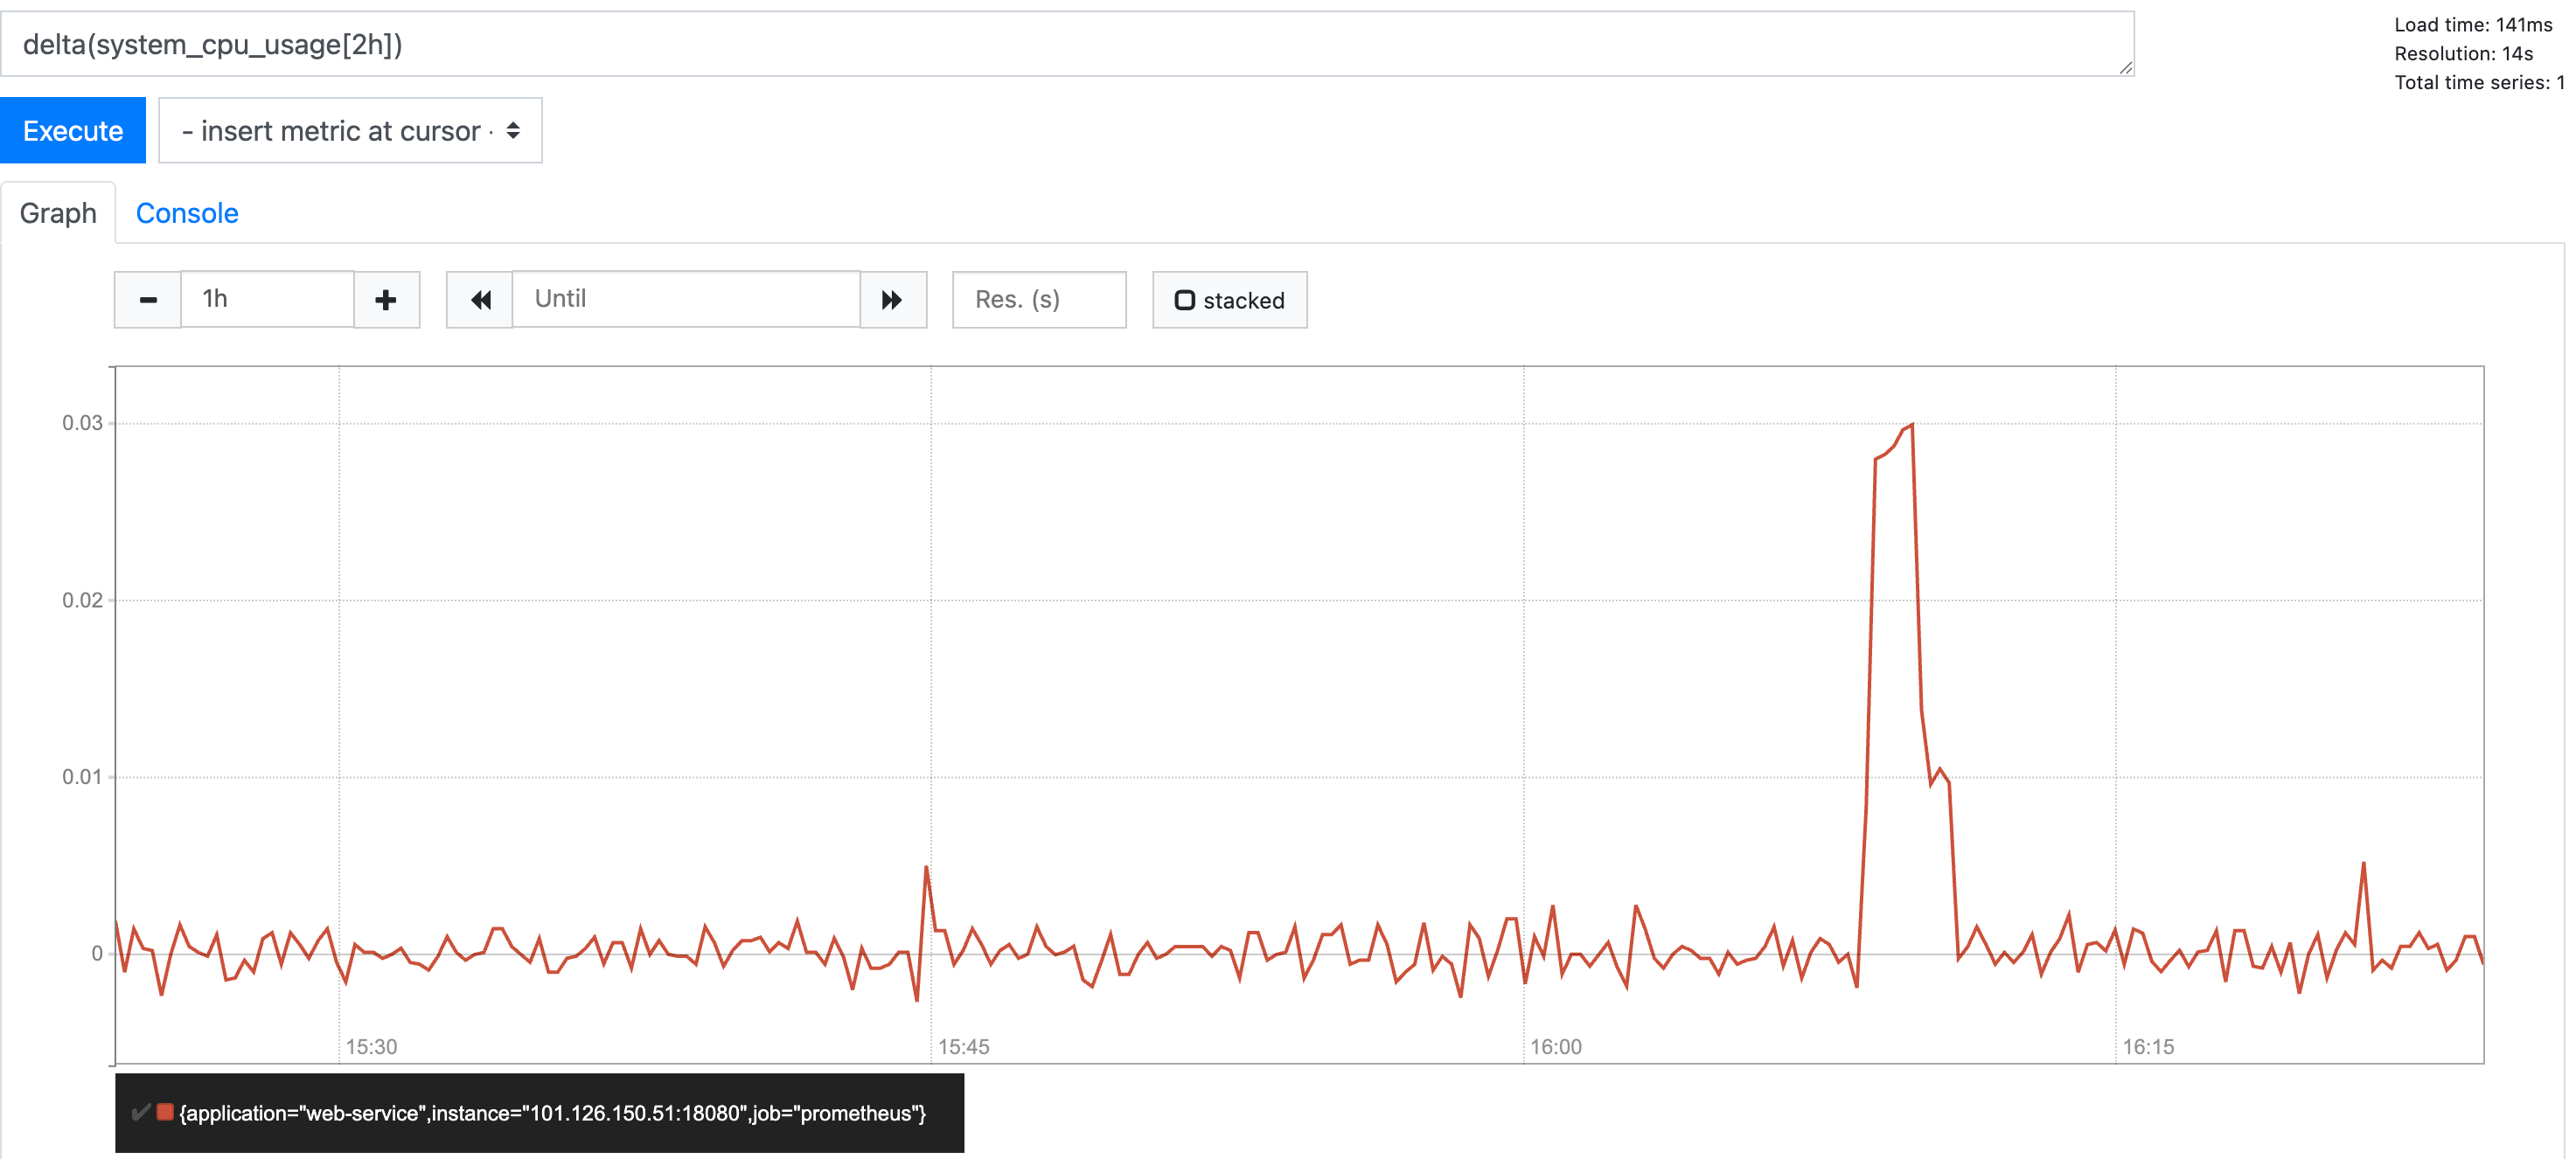
这其中还有用一个针对指标整体浮动变化的函数delta,例如我们有一个cpu的guage指标:
# HELP system_cpu_usage The "recent cpu usage" for the whole system
# TYPE system_cpu_usage gauge
system_cpu_usage{application="web-service",} 0.005636978579481398
2
3
如果我们希望通过cpu浮动情况判断程序资源消耗稳定性就可以通过delta即delta(system_cpu_usage[2h])检测过去2h的cpu浮动变化:
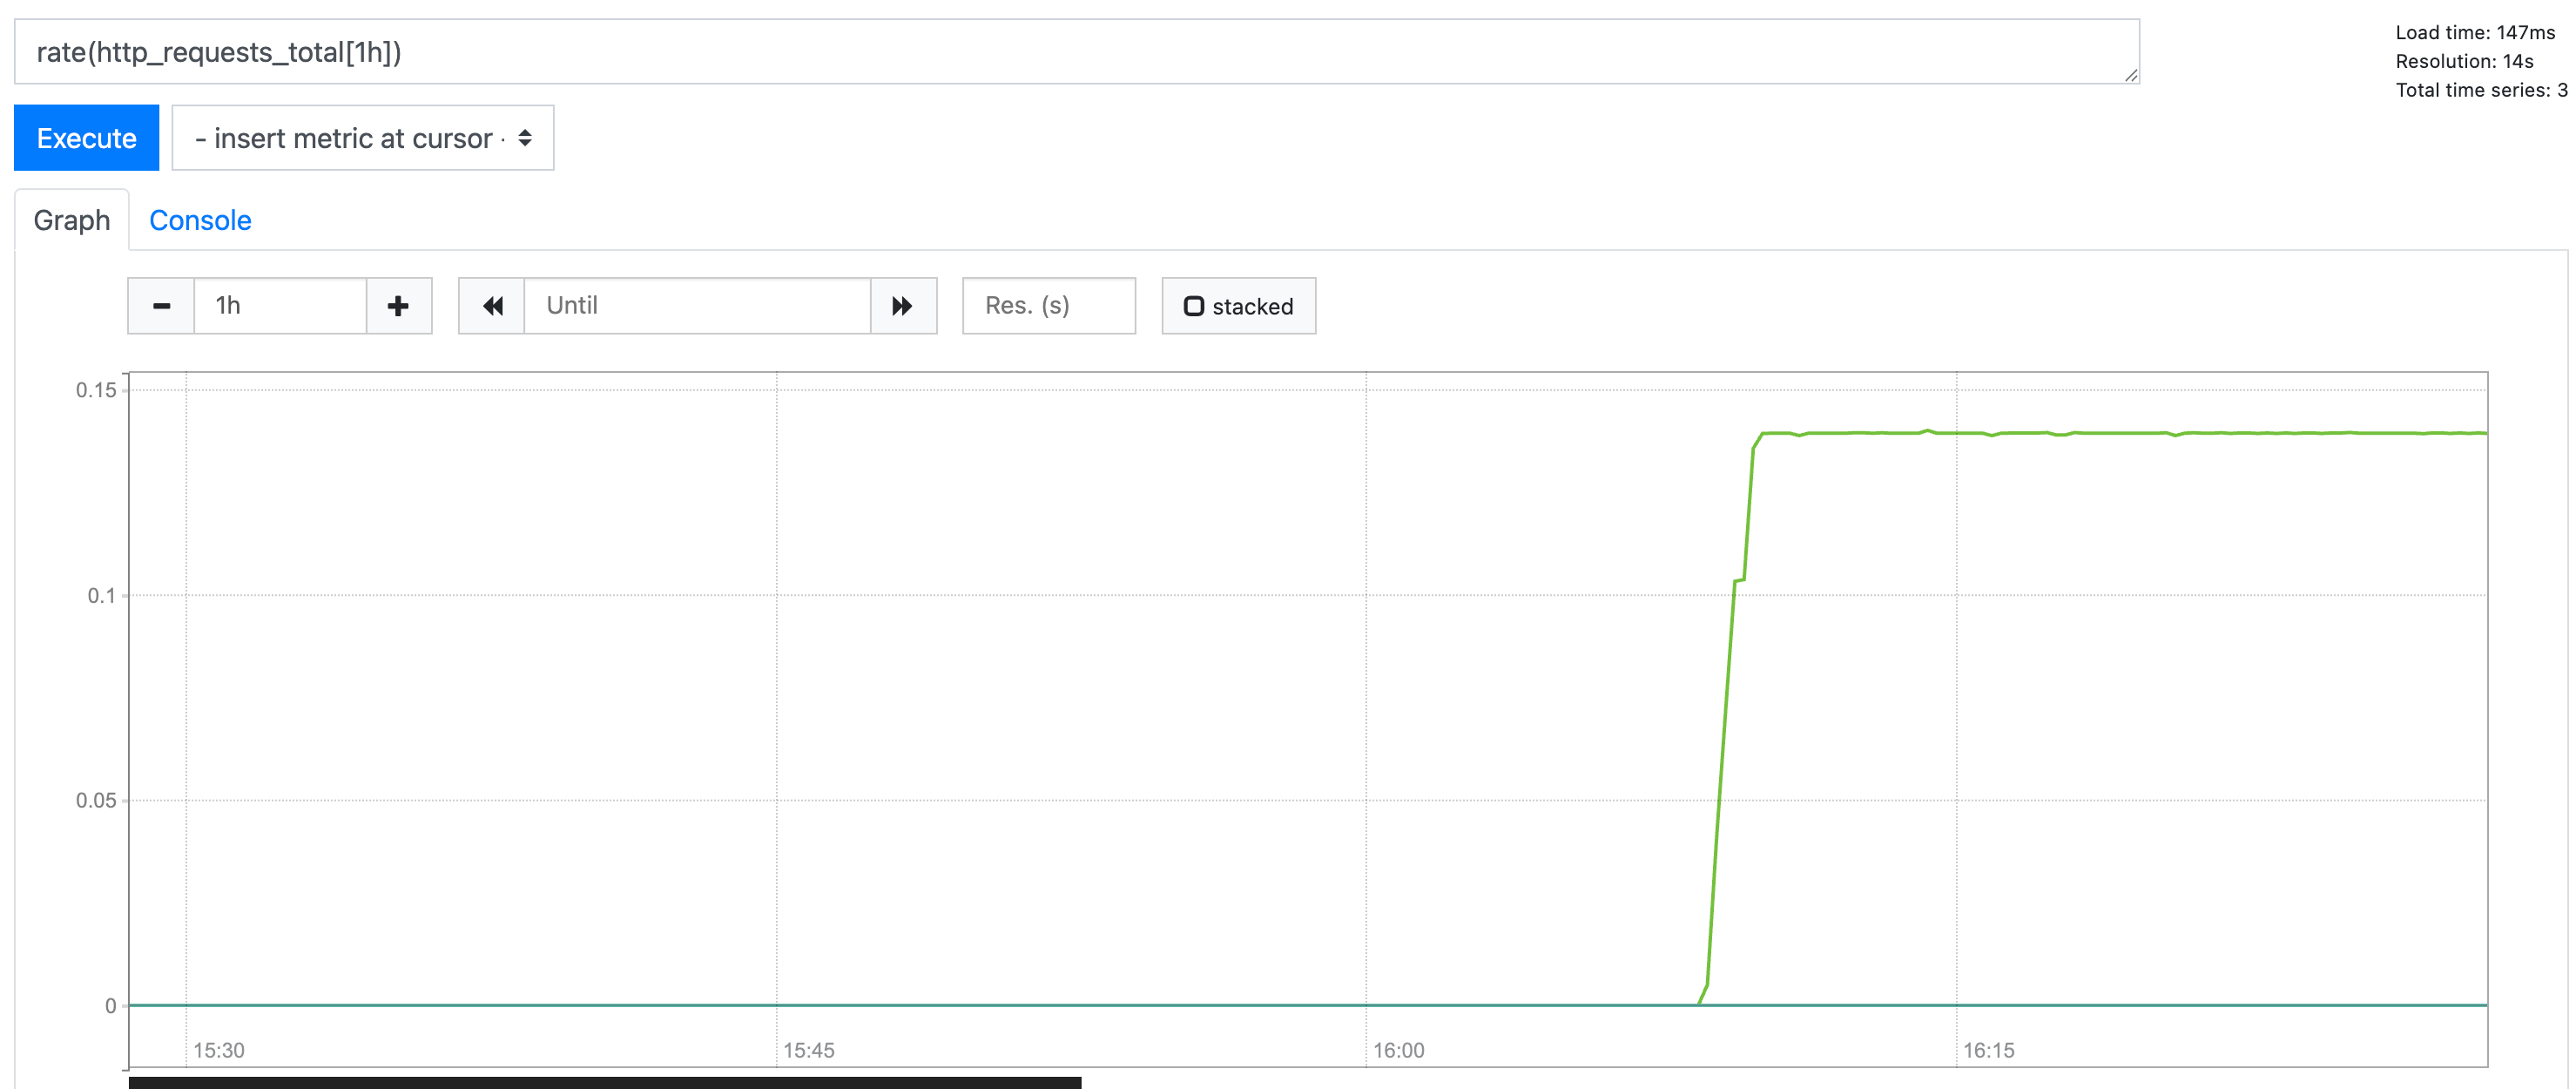
我们在介绍一下比较实用的函数,针对请求接口总数这种单向攀升的指标,我们也会关注它的增长趋势已判断服务器整体资源是否符合未来增长趋势,我们就可以通过rate函数来分析如下接口请求总数指标:
# HELP http_requests_total
# TYPE http_requests_total counter
http_requests_total{application="web-service",url="/test2",} 1.0
http_requests_total{application="web-service",url="/test0",} 2.0
http_requests_total{application="web-service",url="/test1",} 840.0
2
3
4
5
对应表达式为rate(http_requests_total[1h]),对应输出发布图如下,我们可以非常直观的看到test1接口在单位时间内疯狂的攀升:
# 更多关于promQL
更多关于promQL的函数实践和演示,笔者也推荐这份教程: https://flashcat.cloud/tags/promql/ (opens new window)
# 实践——promQL与grafana的串联
# 长尾问题说明
监控的目的本质上是针对指标的趋势分析确保能够对系统有一个准确的决策优化思路,这其中就有一个比较经典的长尾问题,以我们监控接口耗时为例,1min内平均耗时为200ms,但是偶发出现5s,这种偶发波动对于rate等函数进行平均化之后就会被削平,从而无法及时的发现偶发飙升的数值进而无法及时发现问题,这种情况也就是长尾问题。
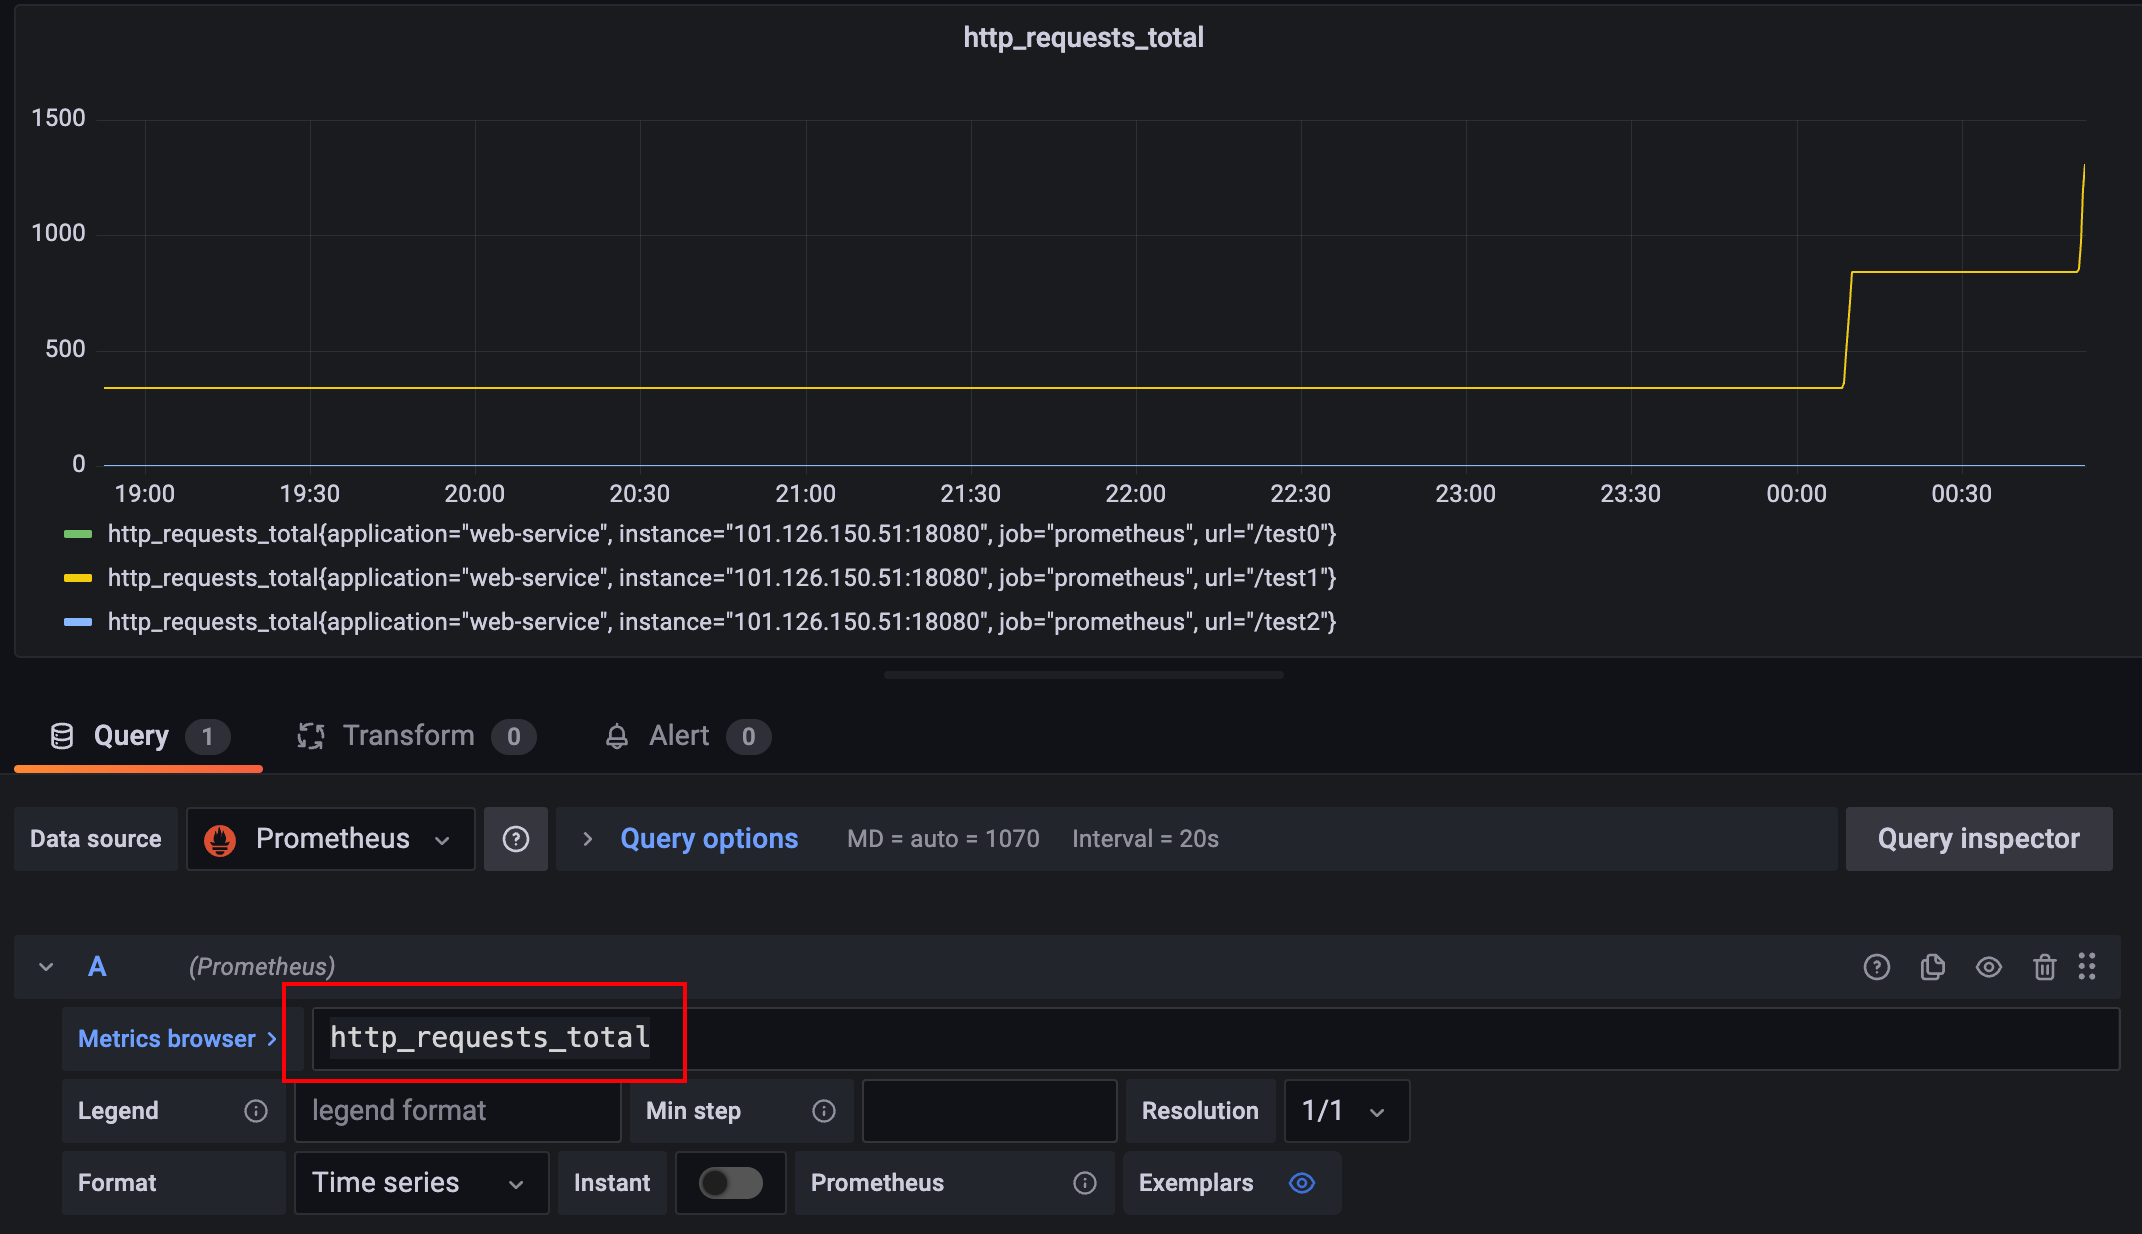
对于此类问题,我们就需要综合指标多维度针对指标进行图表分析,从而进行准确的进一步决策。我们还是以接口请求总数的指标为例,假设此时我们收到接口的请求总数counter情况如下,可以看到有大量请求打到test1上,所以test1的请求总数为910:
# HELP http_requests_total
# TYPE http_requests_total counter
http_requests_total{application="web-service",url="/test2",} 1.0
http_requests_total{application="web-service",url="/test0",} 2.0
http_requests_total{application="web-service",url="/test1",} 910.0
2
3
4
5
6
7
8
9
针对这些接口,笔者也通过timer计时器针对性的进行指标采集,还是以test1说明:
- 请求总数为909(采集时间和上述有些误差)
- 请求总耗时为91s
- 最大耗时为199ms
# HELP method_timed_seconds
# TYPE method_timed_seconds summary
# ......
method_timed_seconds_count{application="web-service",class="com.sharkchili.controller.TestController",exception="none",method="test1",} 909.0
method_timed_seconds_sum{application="web-service",class="com.sharkchili.controller.TestController",exception="none",method="test1",} 91.202510617


# HELP method_timed_seconds_max
# TYPE method_timed_seconds_max gauge
# ......
method_timed_seconds_max{application="web-service",class="com.sharkchili.controller.TestController",exception="none",method="test1",} 0.199230275
2
3
4
5
6
7
8
9
10
11
12
对应的我们将http_requests_total写入粘贴到grafana上渲染后如下图所示:
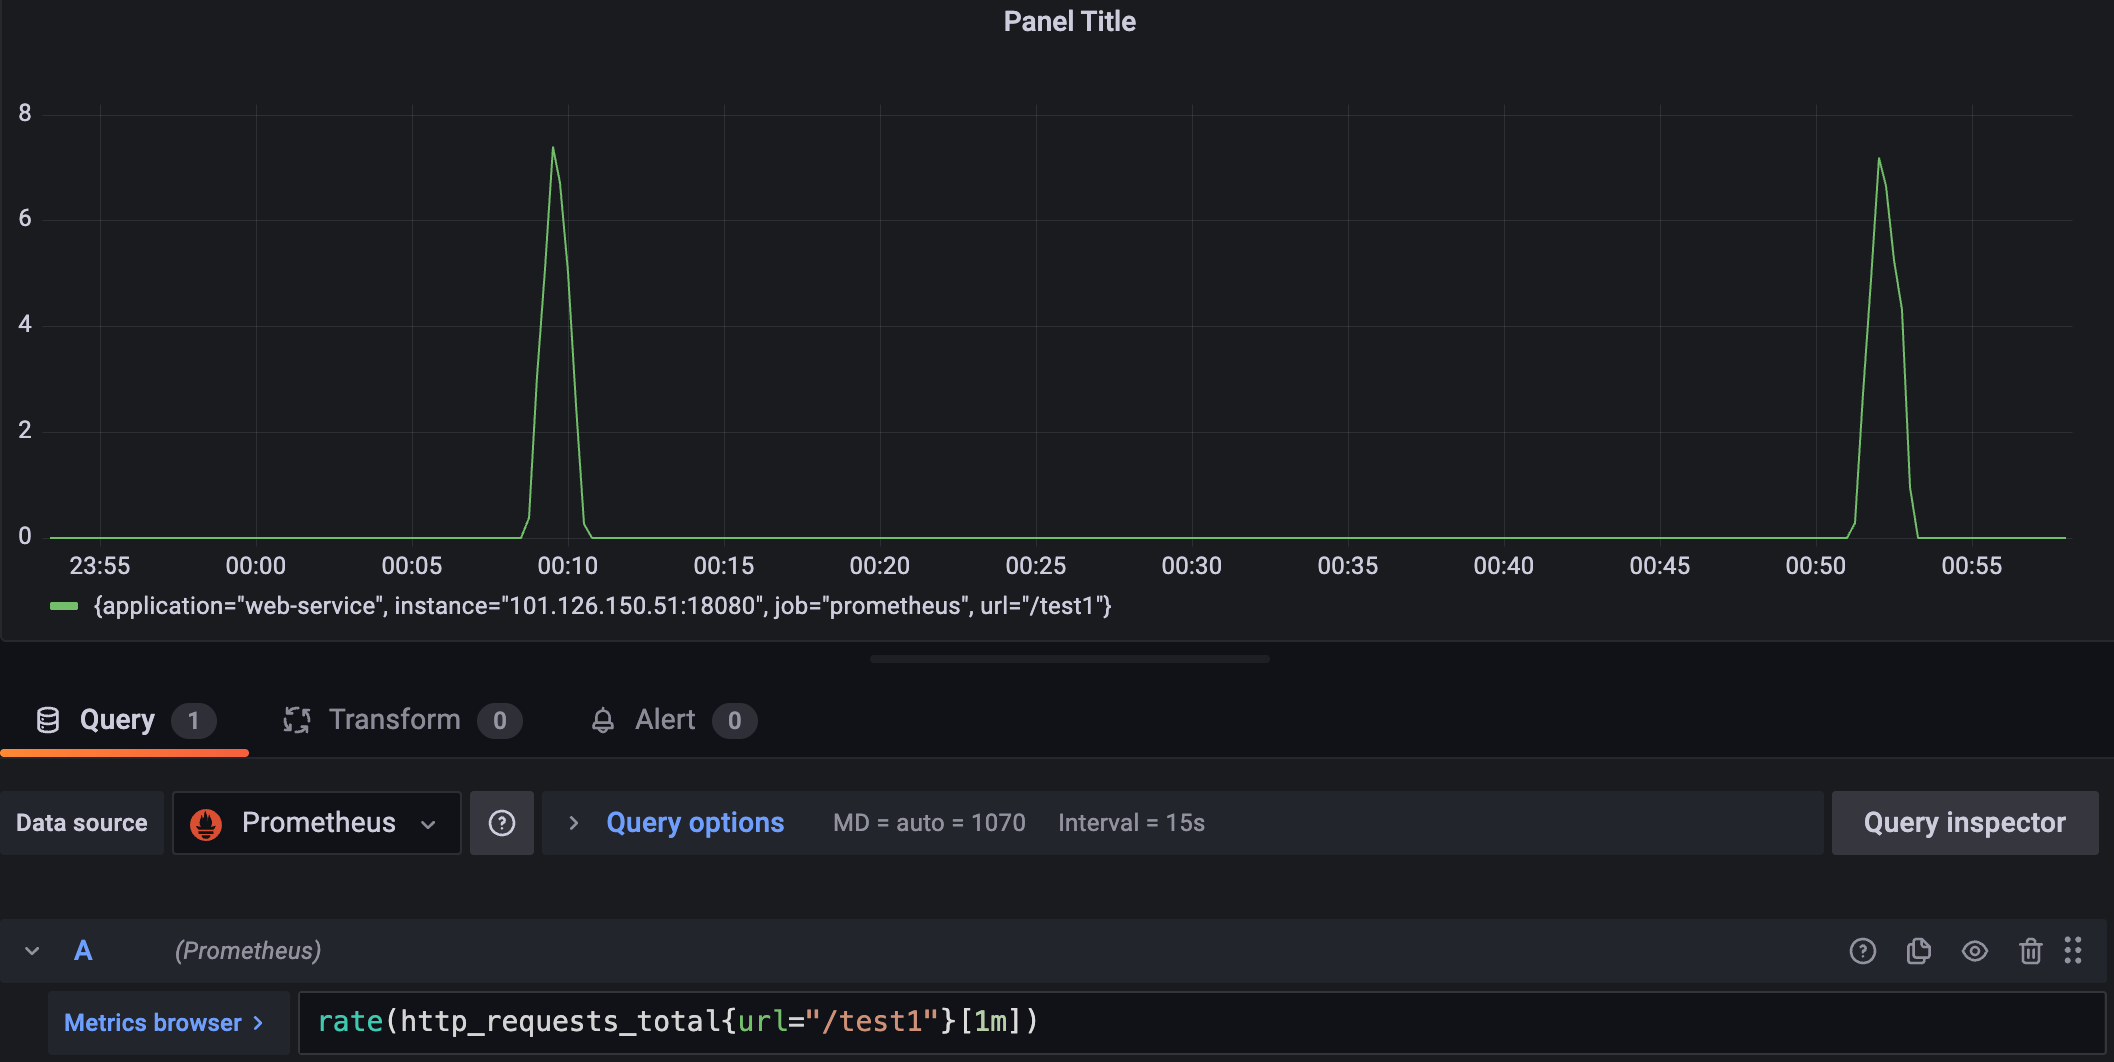
# 基于计数器分析http请求增量情况
我们先通过http_requests_total对接口请求情况进行分析,从整体情况来看test1请求在不断的飙升,所以我们希望针对该接口增量趋势进行分析,于是键入rate(http_requests_total{url="/test1"}[1m])分析了test1接口的增长情况。
可以看到整体是一段时间一段时间的波动,按照实际业务场景可以是服务定时任务在单位时间内的feign请求:
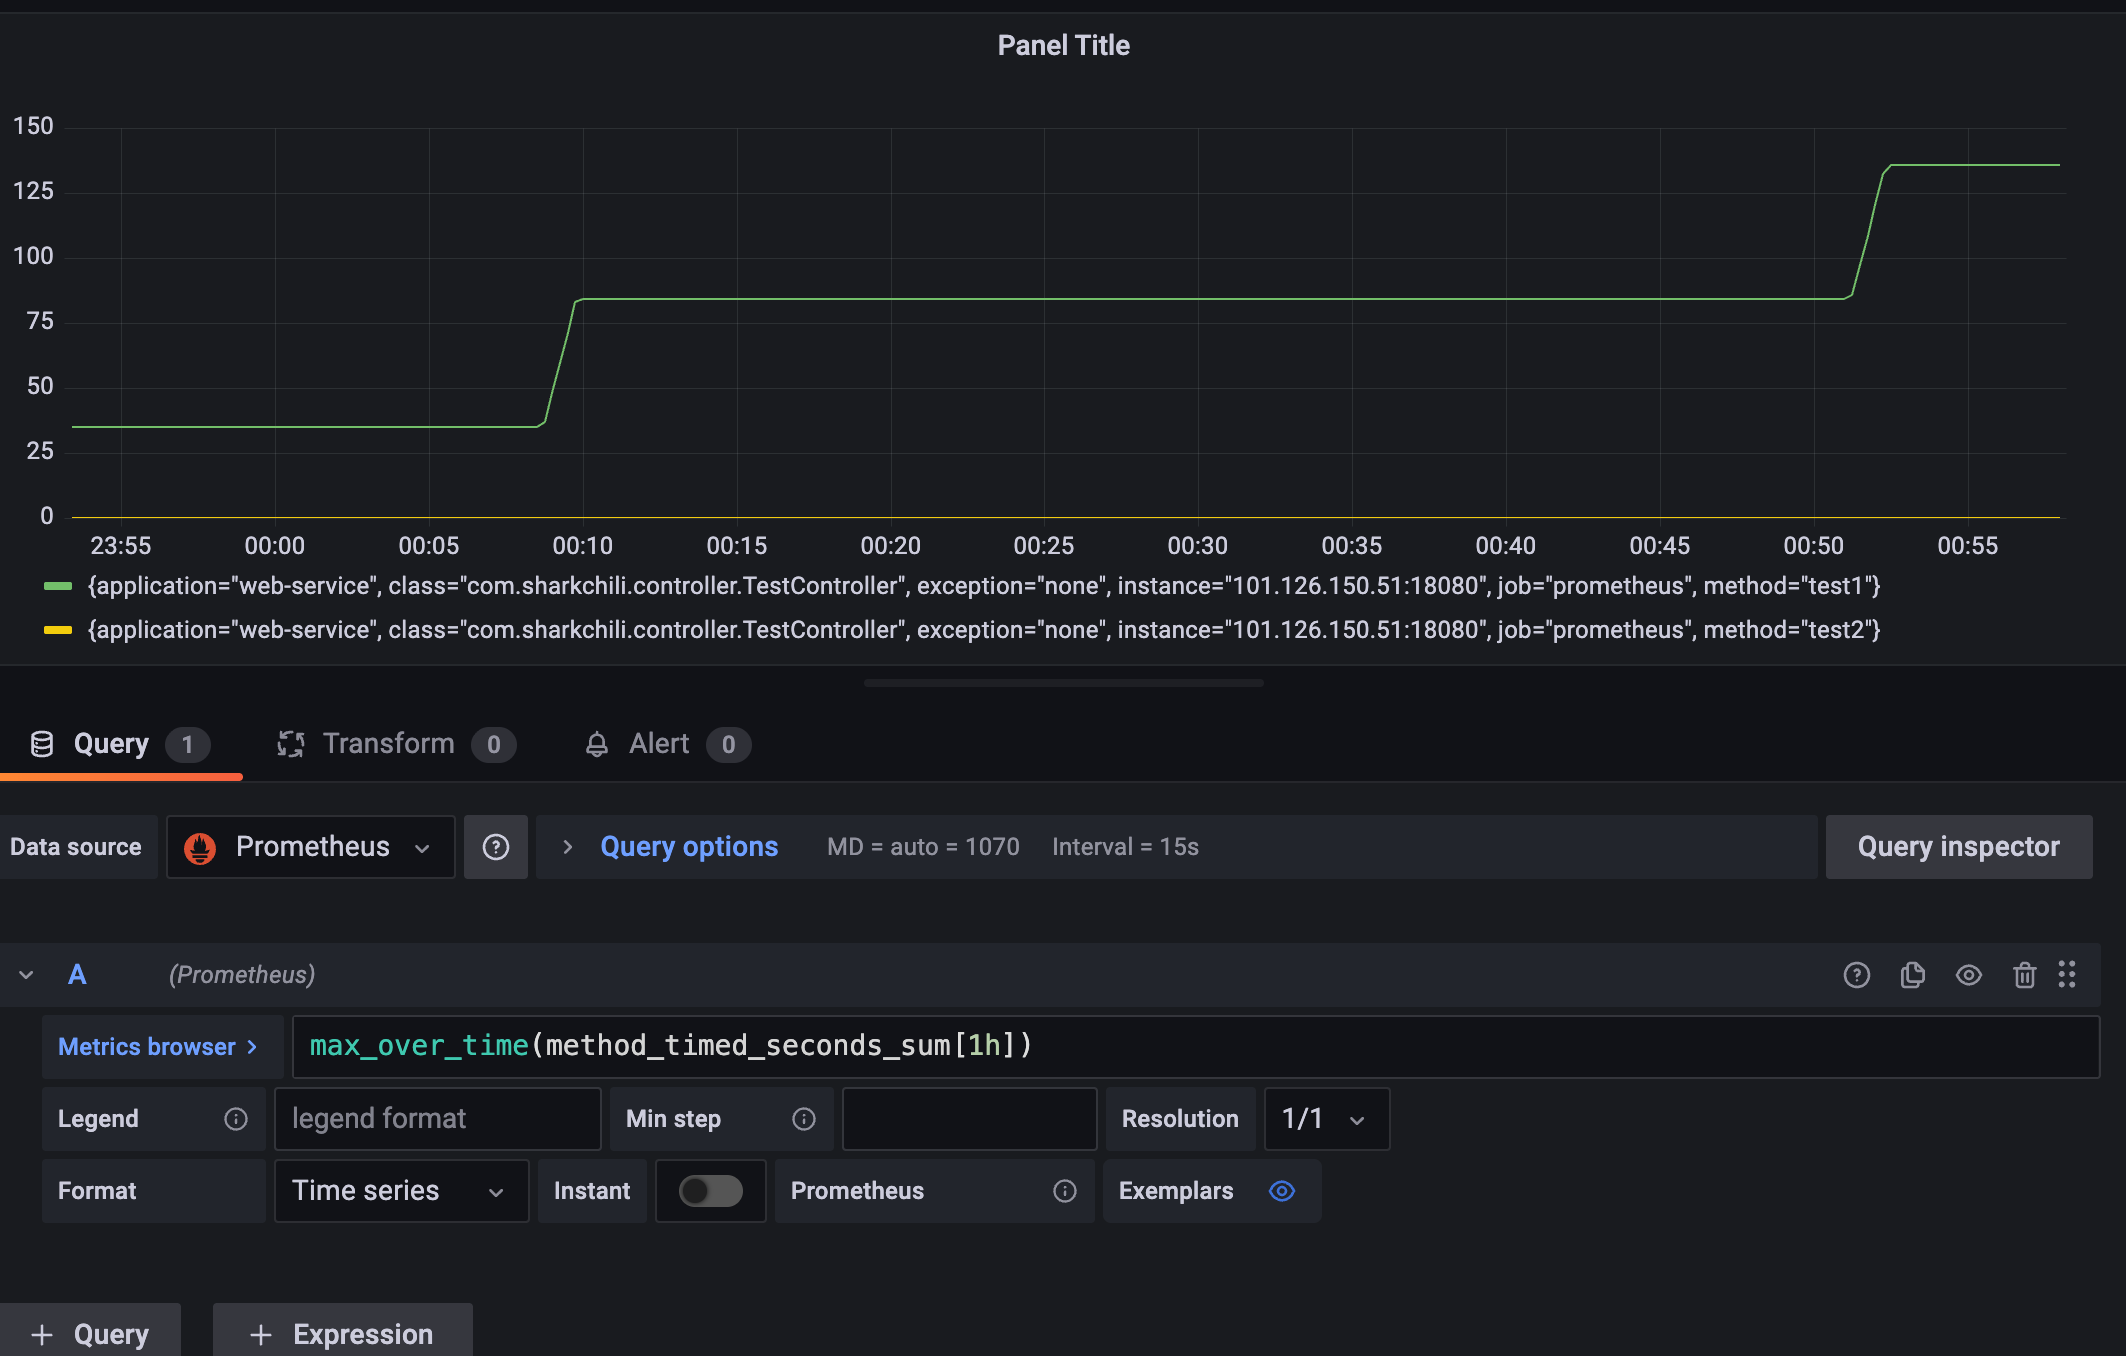
# 基于timer计时器分析接口耗时
看到此波动,就需要关心这个接口的耗时情况,通过timer计时器的指标(method_timed_seconds_)筛选业务峰值的时间区间真是这种飙升的量级请求的各维度耗时进行汇总分析,以确定的接口飙升是否存在瓶颈。
首先我们需要查询接口最大耗时max_over_time(method_timed_seconds_sum[1h])查看过去1h的最大耗时,整体来看基本稳定在200ms以内,符合团队指定的标准:
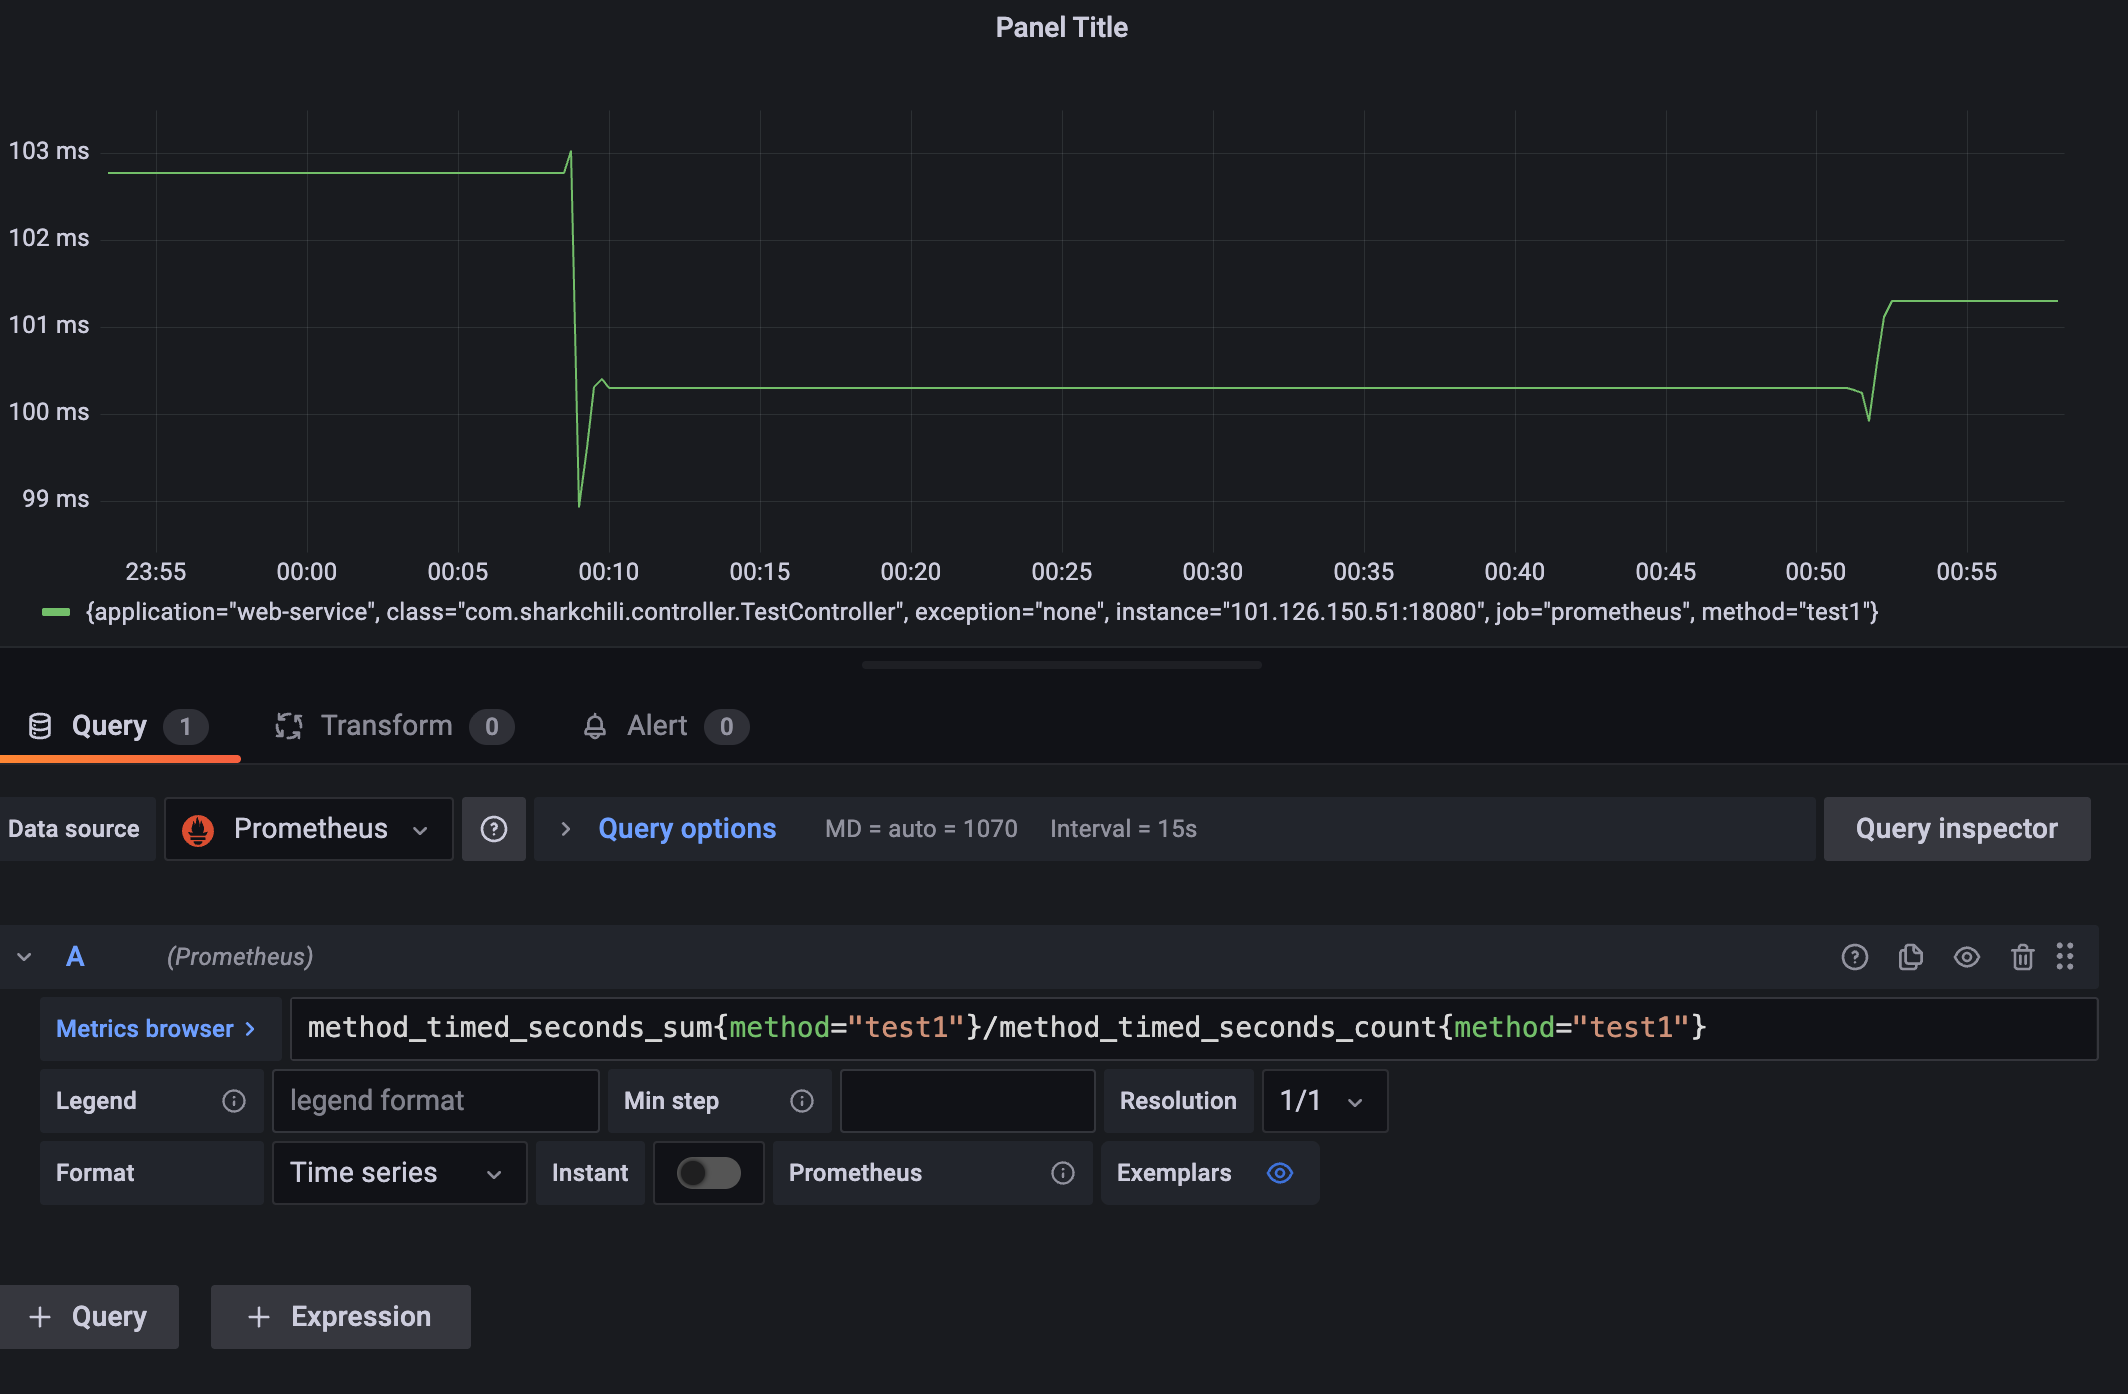
明确没有存在瓶颈的情况下,我们也需要判断接口单位时间内的平均耗时已确定系统过去一段时间是否稳定运行,已确定程序或者系统是否存在波动,已明确是否有隐患,表达式为method_timed_seconds_sum{method="test1"}/method_timed_seconds_count{method="test1"},结合上述指标来看在00:10那一刻请求数飙升所以那段时间平均耗时增加,请求降下来后耗时也将下来了:
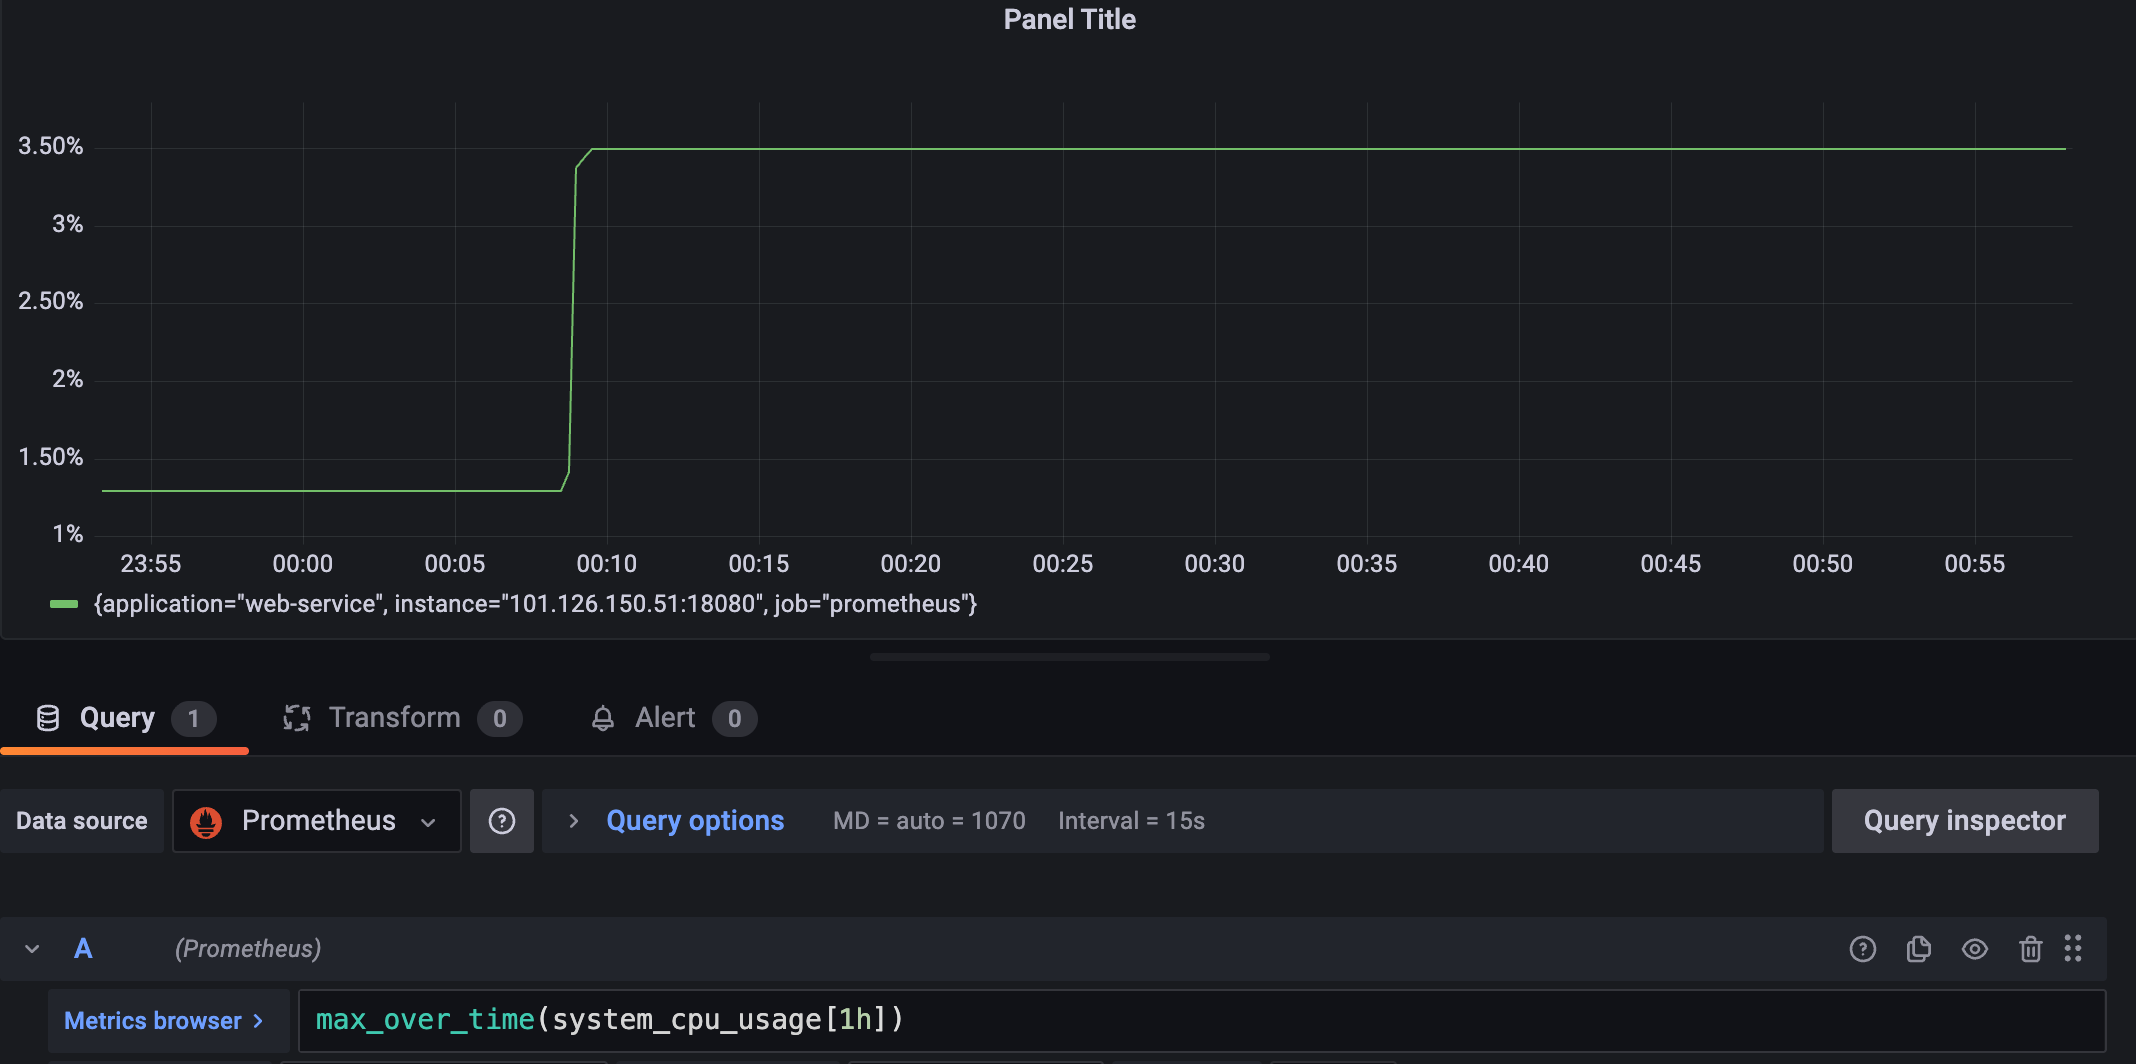
# 基于gauge分析CPU负载情况
最后我们还是需要通过分析一下cpu和内存使用情况已确定这种飙升对于系统的压力如何,我们直接通过max_over_time(system_cpu_usage[1h])查看最大开始也就是3%并没有超过业界认定的瓶颈70%,基本确定没有问题:
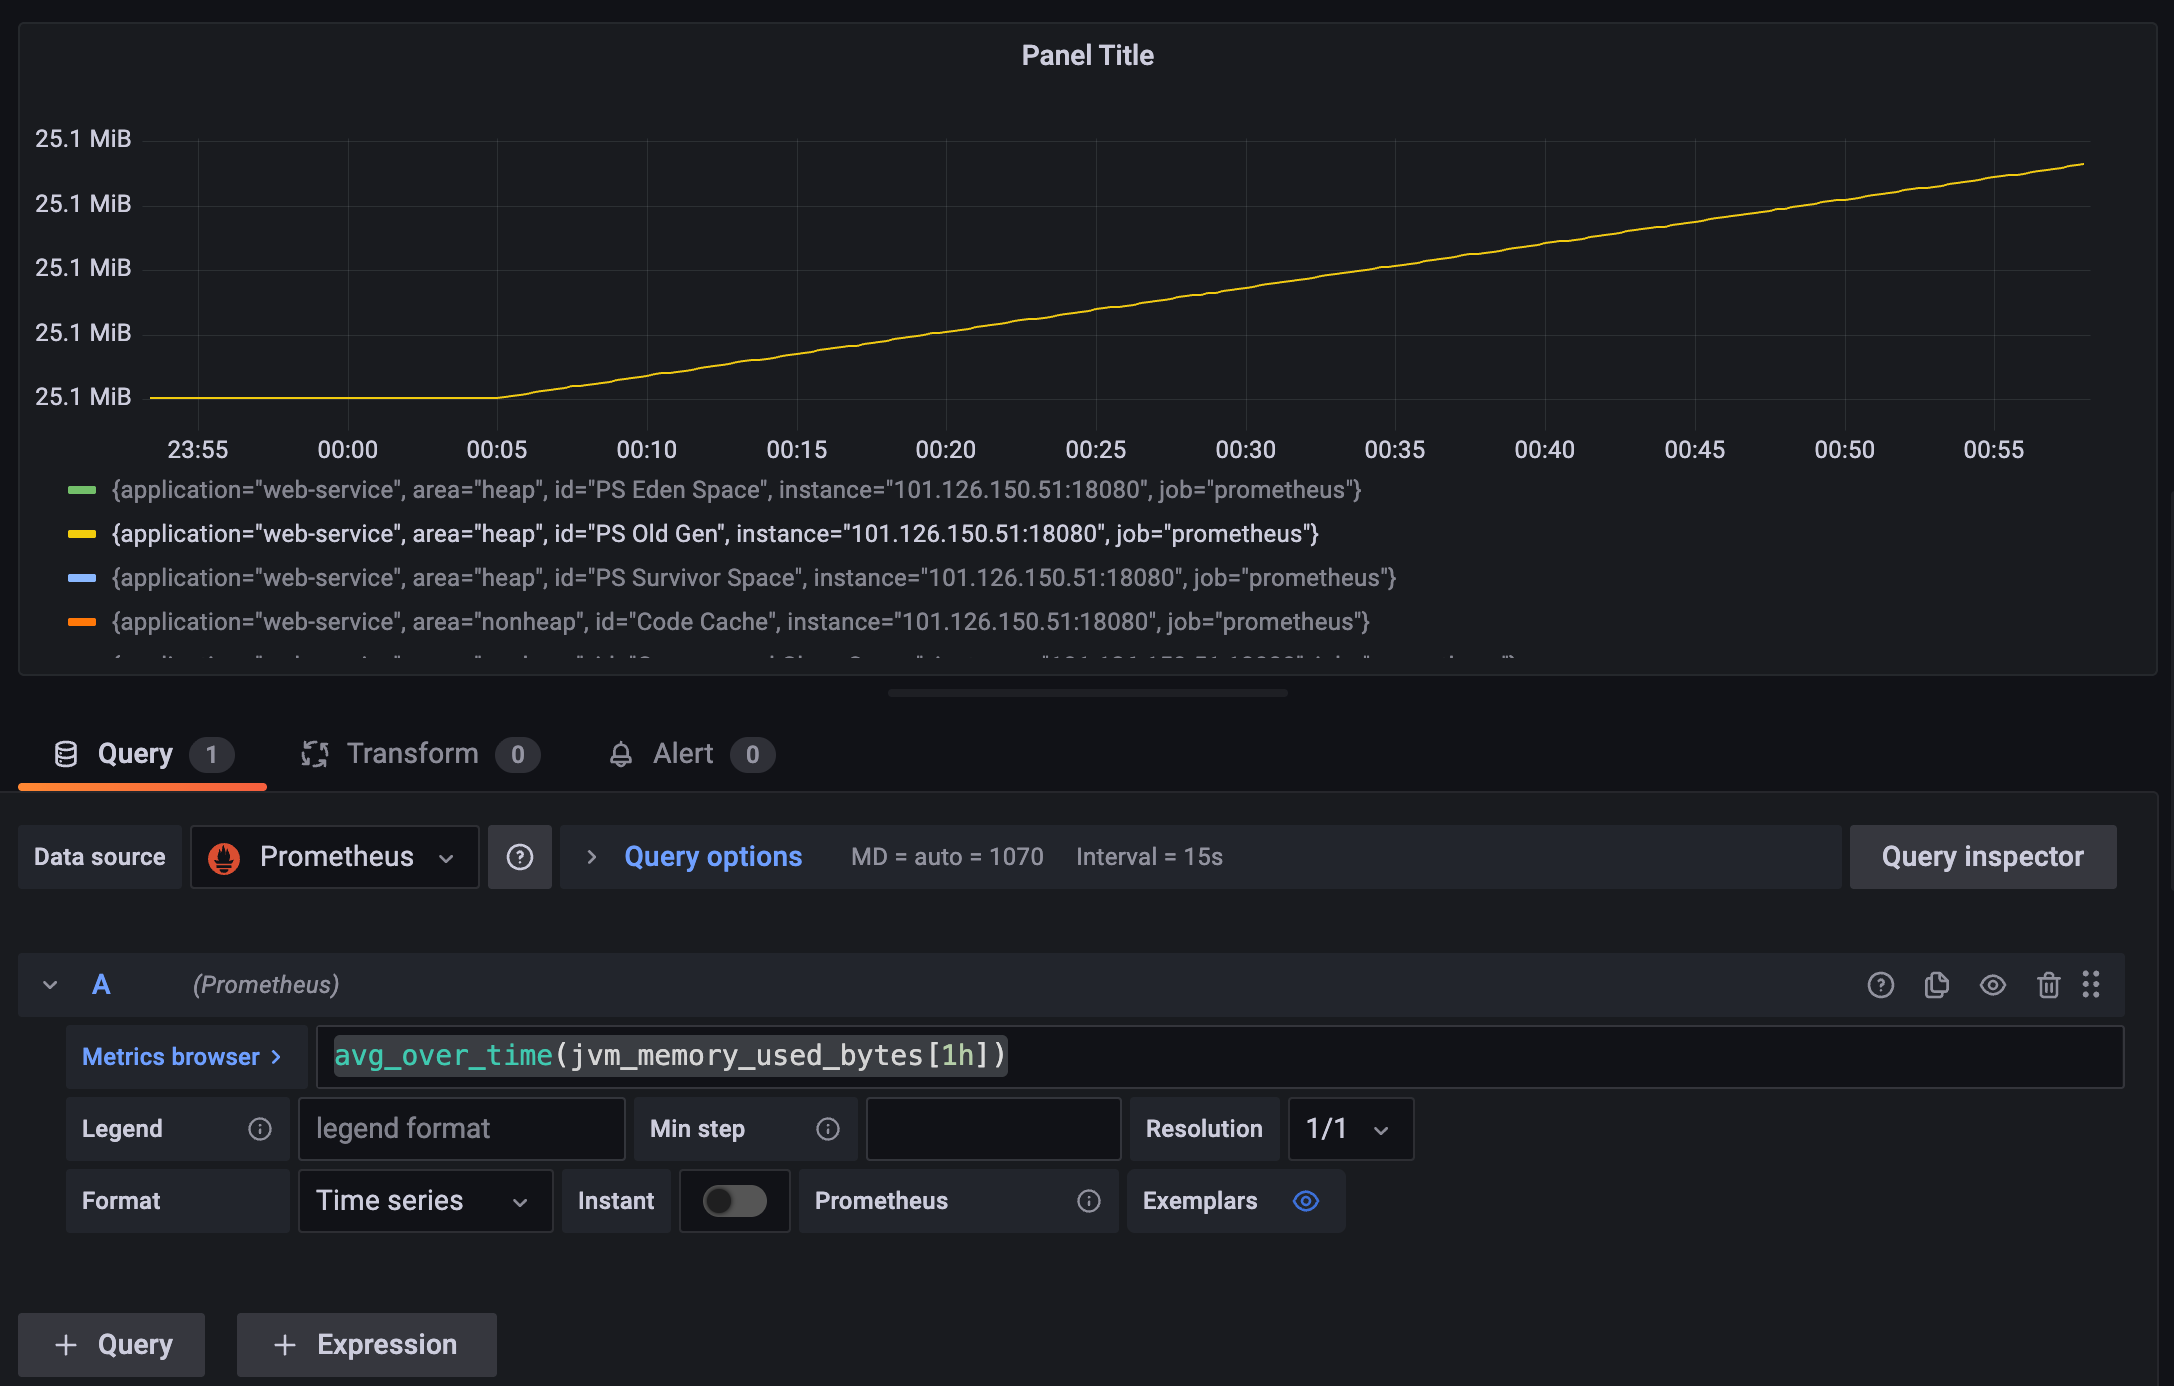
关于内存笔者这里也直接关联到jvm_memory_used_bytes这个guage,通过avg_over_time(jvm_memory_used_bytes[1h])查看过去1h的使用情况,可以看到在00:10新生代飙升到500m左右完成后直接压降:
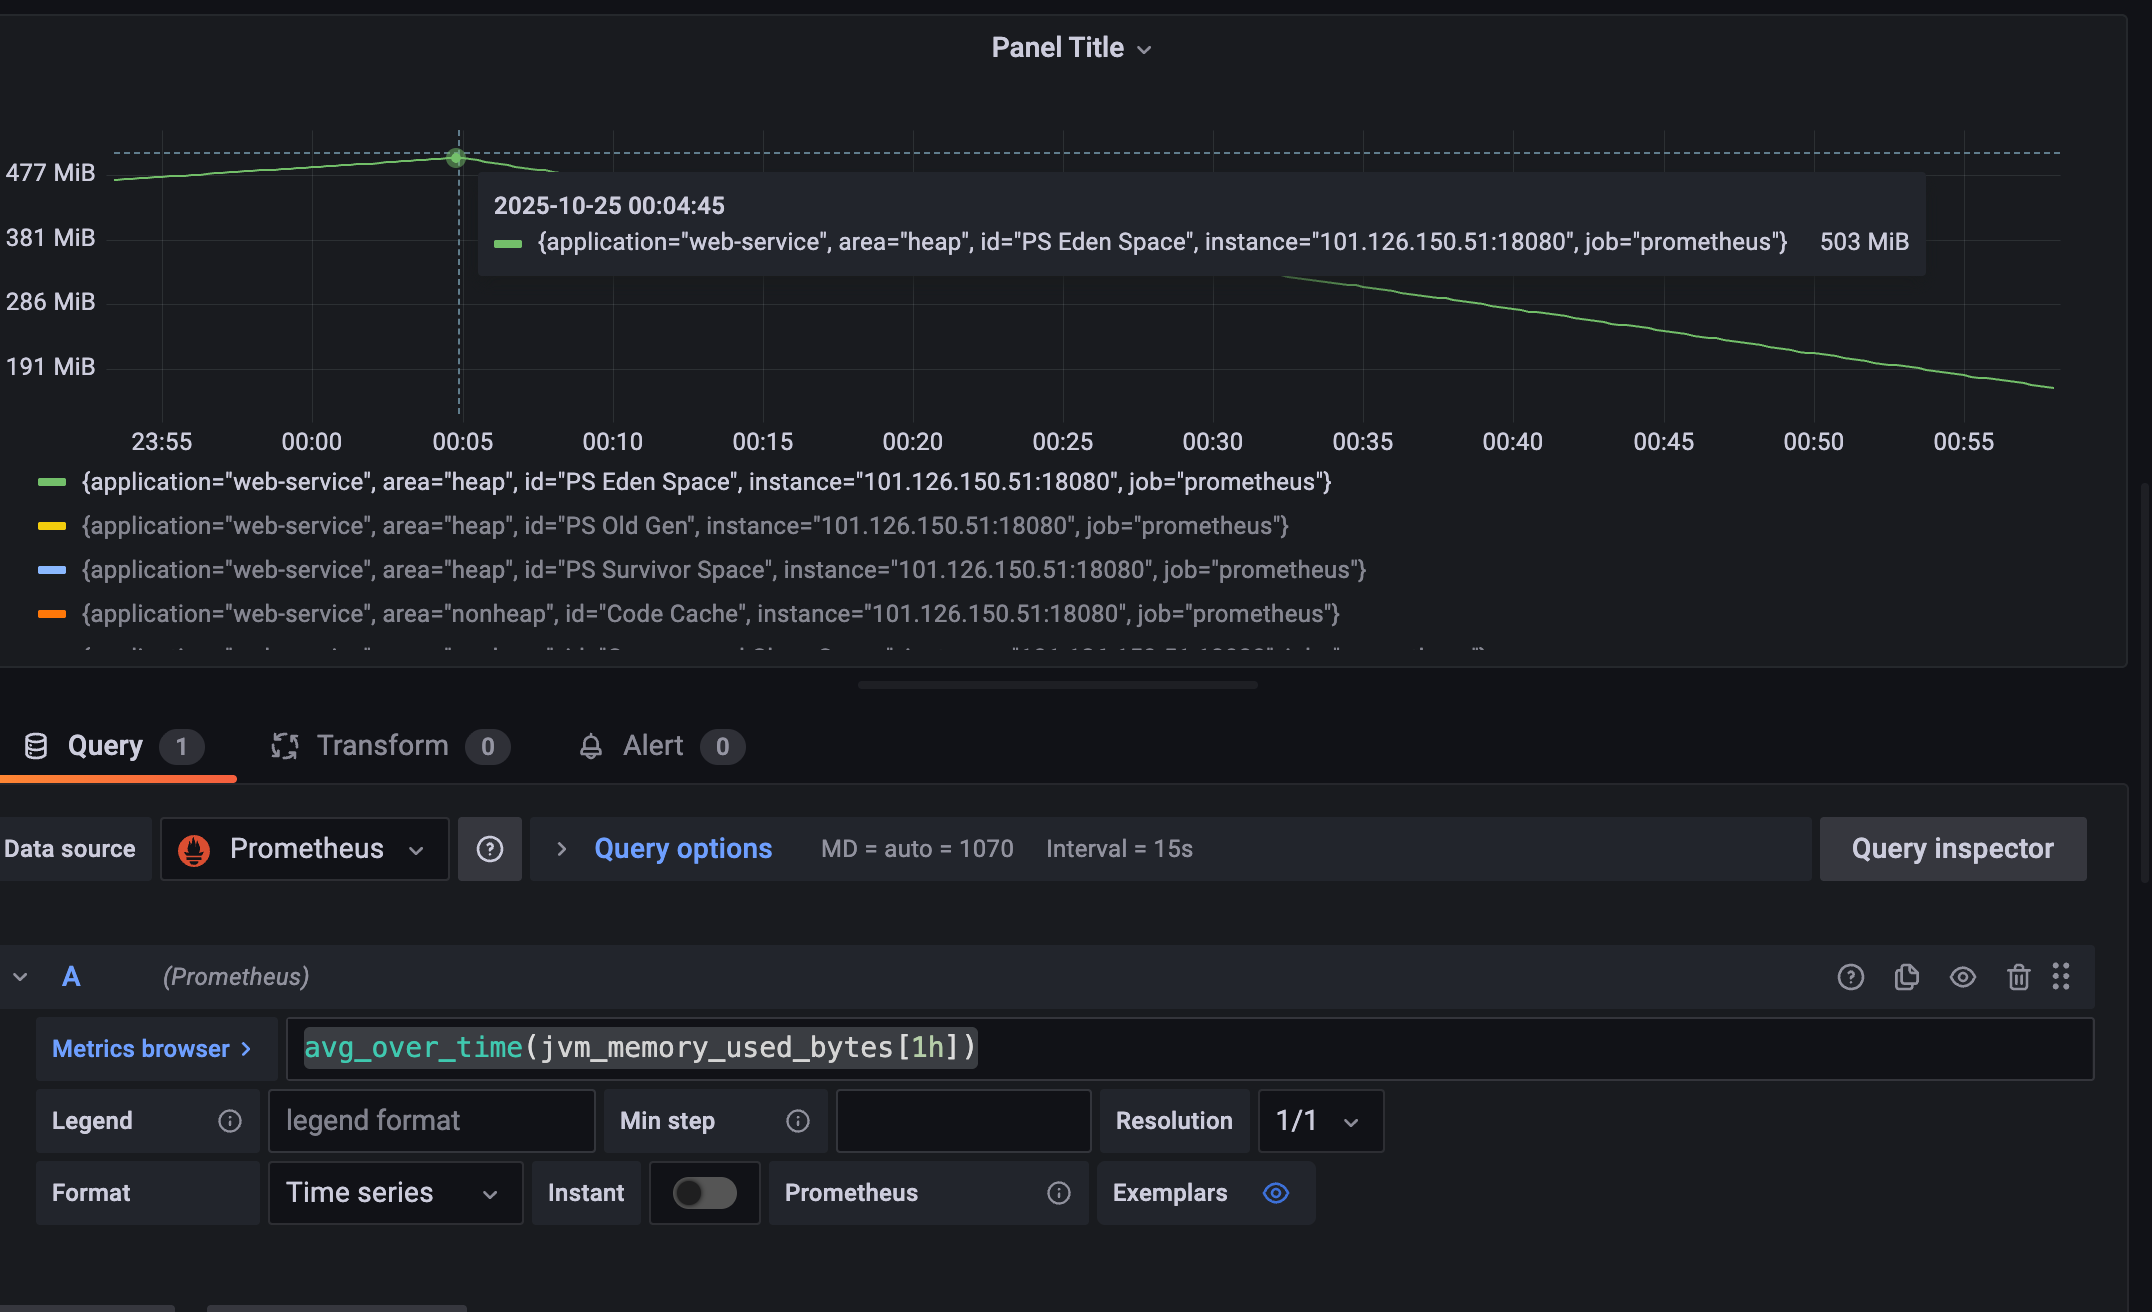
老年带控制在30m以内稳定攀升,还未到达gc临界点,整体来看飙升的接口会很快被gc,所以系统整体情况良好:
为方便笔者直接通过jmap查看当前java进程情况,可以看到堆内存分配的2g左右的堆内存,此时的老年代也没用到最大值仅仅动态扩容到83MB,整体内存使用情况良好:
Heap Configuration:
   MinHeapFreeRatio         = 0
   MaxHeapFreeRatio         = 100
   MaxHeapSize              = 2065694720 (1970.0MB)
   NewSize                  = 42991616 (41.0MB)
   MaxNewSize               = 688390144 (656.5MB)
   OldSize                  = 87031808 (83.0MB)
   NewRatio                 = 2
   SurvivorRatio            = 8
   MetaspaceSize            = 21807104 (20.796875MB)
   CompressedClassSpaceSize = 1073741824 (1024.0MB)
   MaxMetaspaceSize         = 17592186044415 MB
   G1HeapRegionSize         = 0 (0.0MB)
2
3
4
5
6
7
8
9
10
11
12
13
# 小结
本文深入分析了java常用计量仪micrometer中:
- 有状态累加计量器counter
- 无状态仪表盘gauge
- 大量短耗时时间指标采集工具timer
基于这些指标我们结合通过promQL函数进行多维度的演示并给出了日常生产故障分析和排查步骤,希望对你有帮助。
我是 SharkChili ,Java 开发者,Java Guide 开源项目维护者。欢迎关注我的公众号:写代码的SharkChili,也欢迎您了解我的开源项目 mini-redis:https://github.com/shark-ctrl/mini-redis (opens new window)。
为方便与读者交流,现已创建读者群。关注上方公众号获取我的联系方式,添加时备注加群即可加入。
# 参考
保姆级 Prometheus PromQL 讲解与实战操作 :https://cloud.tencent.com/developer/article/2242333 (opens new window)
Prometheus官方文档:https://prometheus.ac.cn/docs/prometheus/latest/querying/functions/ (opens new window)
长尾优化汇总 :https://juejin.cn/post/7170872097151909919 (opens new window)
Spring AOP统一功能处理(切面、切点、连接点、通知)(上) :https://developer.aliyun.com/article/1202048 (opens new window)
Micrometer源码分析 :https://juejin.cn/post/7254032949230469181#heading-15 (opens new window)
【博客488】prometheus-----长尾问题,跳变问题,数据外推问题,增量丢失问题:https://blog.csdn.net/qq_43684922/article/details/126814495#:~:text=本文深入探讨了Prometheus在监控中遇到的长尾问题,解释了rate和irate函数在处理快速变化数据时的局限性,以及irate如何更好地反映瞬时变化。,同时,文章详细阐述了Counter类型的指标在数据跳变时的处理方式,特别是Prometheus如何自动处理Counter重置。 此外,还讨论了数据外推的概念,特别是在rate和increase函数中的应用。 (opens new window)
