 SpringBoot集成Prometheus与Grafana监控
@[toc]
# 写在文章开头
生产环境瞬息万变,主流的架构都是通过Prometheus进行数据采集指标并通过grafana进行增强式渲染,这种操作也就是我们常说的监控埋点。而本文将针对这套主流部署方案进行全面的介绍,并给出一个针对spring boot应用程序的监控埋点案例,希望对你有帮助。
我是 SharkChili ,Java 开发者,Java Guide 开源项目维护者。欢迎关注我的公众号:写代码的SharkChili,也欢迎您了解我的开源项目 mini-redis:https://github.com/shark-ctrl/mini-redis (opens new window)。
为方便与读者交流,现已创建读者群。关注上方公众号获取我的联系方式,添加时备注加群即可加入。
# 详解spring boot应用埋点实践
# 基本架构说明
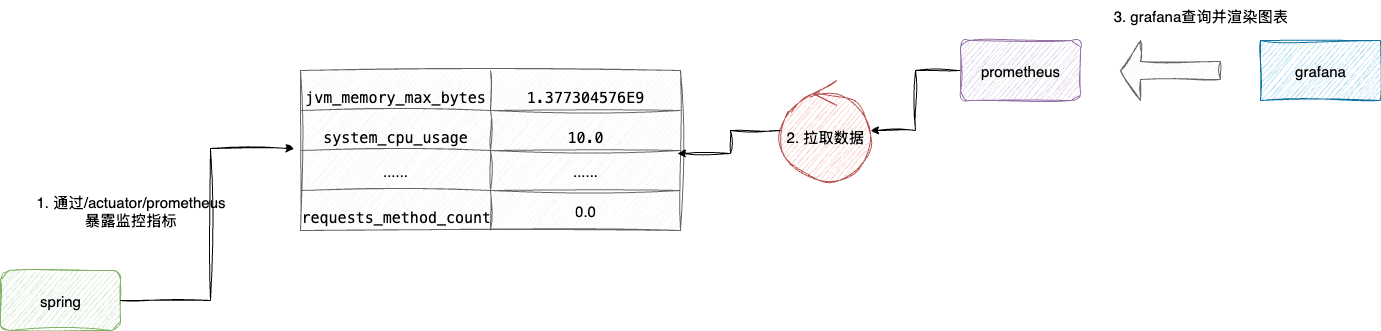
按照主流的java开发技术栈,主流监控埋点方案为:
spring actuator暴露监控指标prometheus拉取采集采集指标grafana定时查询prometheus指标完成图表渲染
对应监控埋点通信架构如下图所示:
# spring boot应用集成prometheus
有了上述的基本概念,我们就可以尝试落地这套方案了,首先自然是在应用中集成必要的依赖:
spring-boot-starter-actuator:暴露spring内置的各项监控指标,因为该依赖默认已经完成了对Prometheus的支持,所以引入该依赖后救护内置许多Prometheus风格的端点数据。micrometer-registry-prometheus:用于将用户自定义监控吗指标以prometheus风格输出
<!--暴露spring监控指标-->
        <dependency>
            <groupId>org.springframework.boot</groupId>
            <artifactId>spring-boot-starter-actuator</artifactId>
            <version>2.4.1</version>
        </dependency>

        <!--用于导出prometheus系统类型的指标数据-->
        <dependency>
            <groupId>io.micrometer</groupId>
            <artifactId>micrometer-registry-prometheus</artifactId>
            <version>1.1.4</version>
        </dependency>
2
3
4
5
6
7
8
9
10
11
12
13
application.properties或application.yml文件添加如下几项配置,对应含义笔者都已详细注释,这里笔者需要补充说明的是base-path这个配置,默认情况下,我们暴露出去的端点映射为/actuator,如果考虑到安全抑或是其他方面的顾虑,读者可以修改映射地址:
# 暴露并开启所有的端点
management.endpoints.web.exposure.include=*
# 展示所有的健康信息
management.endpoint.health.show-details=always
# 默认/actuator/Prometheus,添加这个tag方便区分不同的工程
management.metrics.tags.application=${spring.application.name}
# Actuator 监控端点独立端口设置为 18080(与主应用端口分离)
management.server.port=18080
# Actuator 端点的根路径改为 /management(默认是 /actuator)
#management.endpoints.web.base-path=/management
2
3
4
5
6
7
8
9
10
11
声明一个配置类,声明一个MeterRegistryCustomizer表达式附加通用标记列表以应用于报告给监视系统的所有指标,必须是偶数个参数,表示标记的键值对,以笔者为例这里针对所有指标打上application方便后续prometheus可以通过工程名区分监控指标:
@Configuration
public class MeterRegistryConfig {

    @Bean
    MeterRegistryCustomizer<MeterRegistry> configurer(@Value("${spring.application.name}") String applicationName) {
        //将应用指标用打上application标签,值为应用名,方便后续prometheus根据应用名做区分
        return registry -> registry.config().commonTags("application", applicationName);
    }

}
2
3
4
5
6
7
8
9
10
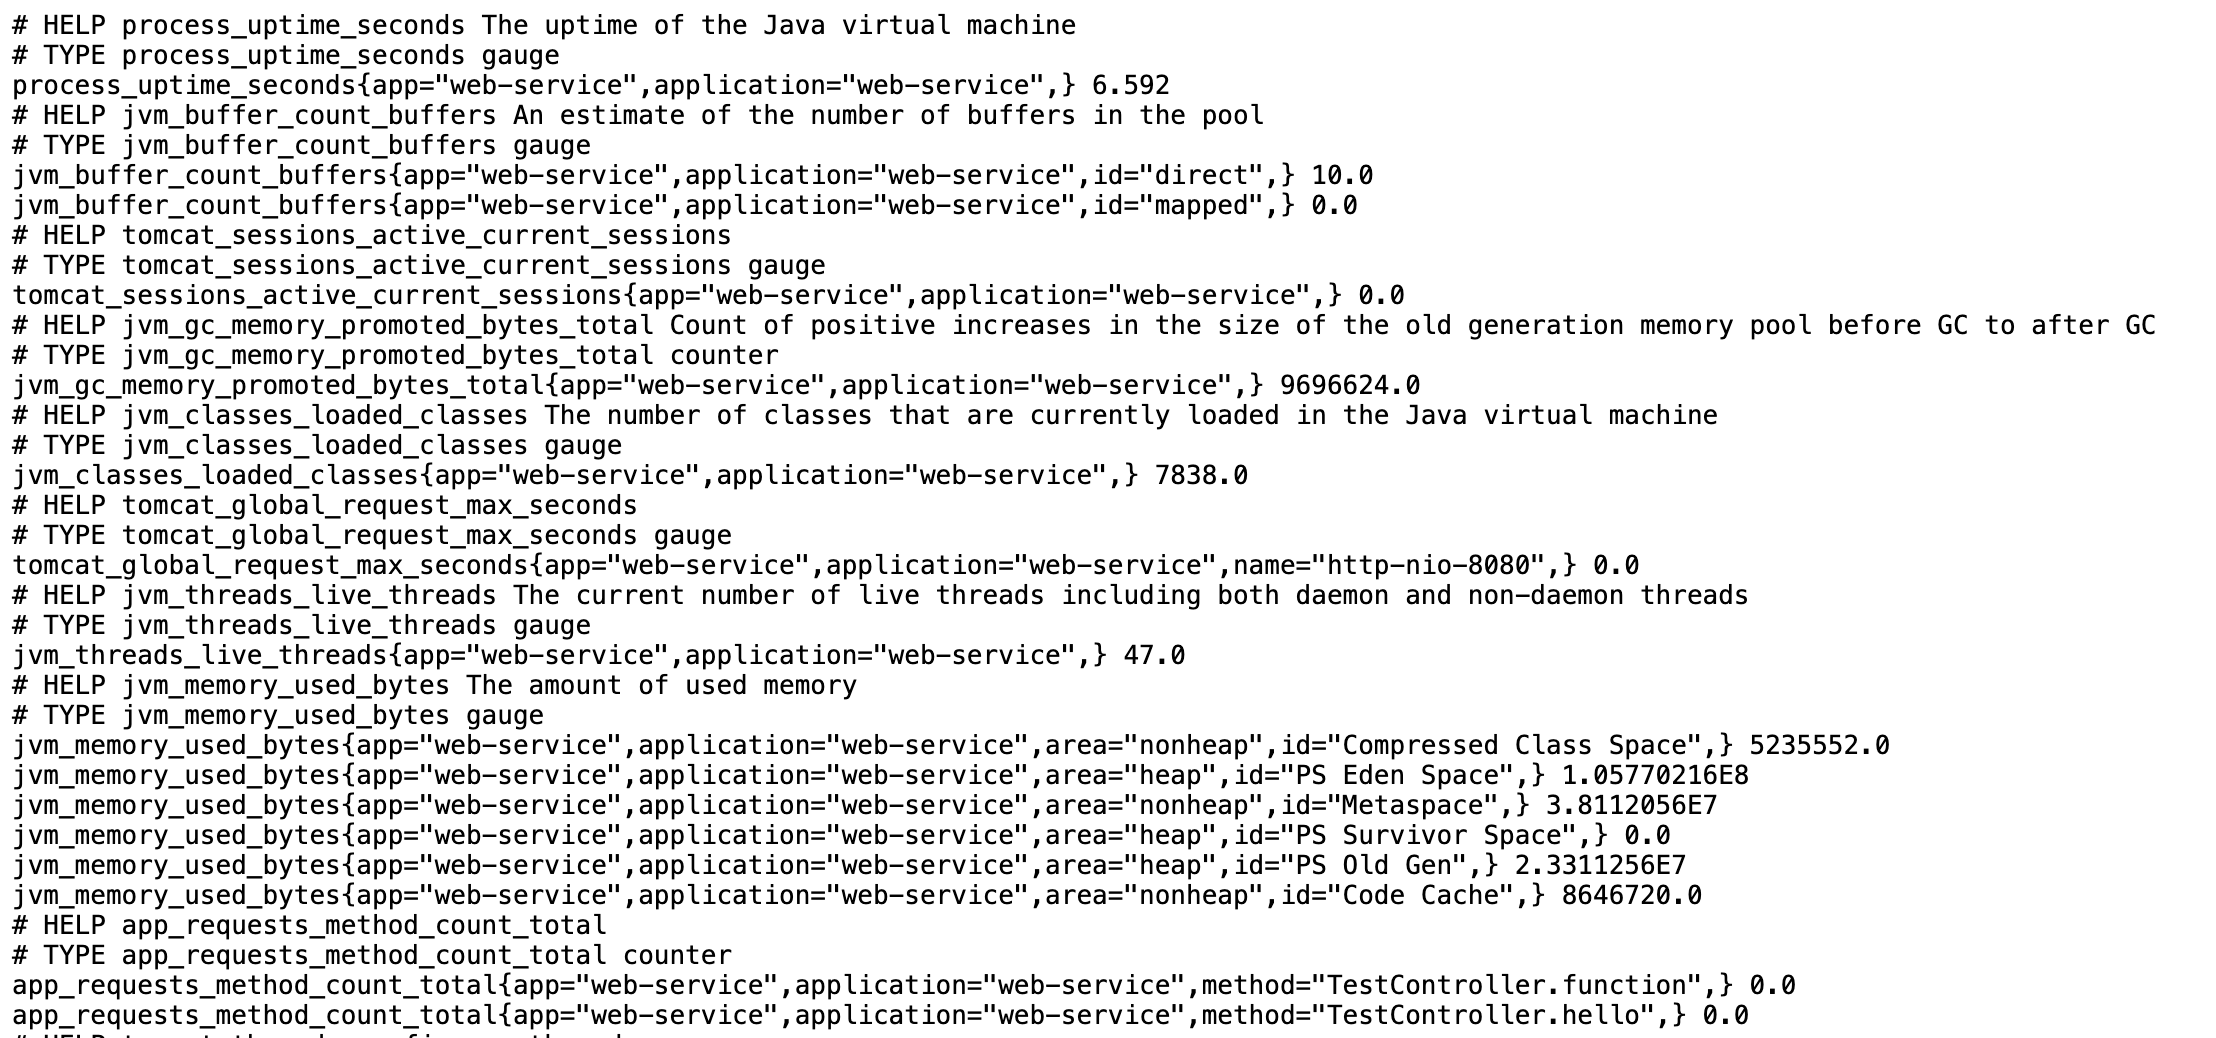
完成上述配置后,我们可以将应用启动,并访问http://127.0.0.1:18080/actuator/prometheus,即可看到应用的各种actuator指标:
# prometheus安装
键入wget指令完成prometheus压缩包下载,这里笔者下载的是2.11.1版本:
sudo wget https://github.com/prometheus/prometheus/releases/download/v2.11.1/prometheus-2.11.1.linux-amd64.tar.gz
完成下载后,将其解压缩并重命名为prometheus方便后续定位和使用:
tar -xvf prometheus-2.11.1.linux-amd64.tar.gz
 mv prometheus-2.11.1.linux-amd64 prometheus
2
执行vim prometheus.yml 追加如下配置:
job_name:配置当前监控指标数据源的标签metrics_path:指明查询端点路径static_configs:通过targets指明配置数据的拉取路径的目标端点的ip和端口号
# A scrape configuration containing exactly one endpoint to scrape:
# Here it's Prometheus itself.
scrape_configs:
  # The job name is added as a label `job=<job_name>` to any timeseries scraped from this config.
  - job_name: 'prometheus'
    # metrics_path defaults to '/metrics'
    # scheme defaults to 'http'.
    # 这里配置需要拉取度量信息的URL路径,这里选择应用程序的prometheus端点
    metrics_path: '/actuator/prometheus'
    static_configs:
      # 这里配置host和port
      - targets: ['127.0.0.1:18080']
2
3
4
5
6
7
8
9
10
11
12
进入目录并将prometheus启动:
cd prometheus/
sudo ./prometheus
2
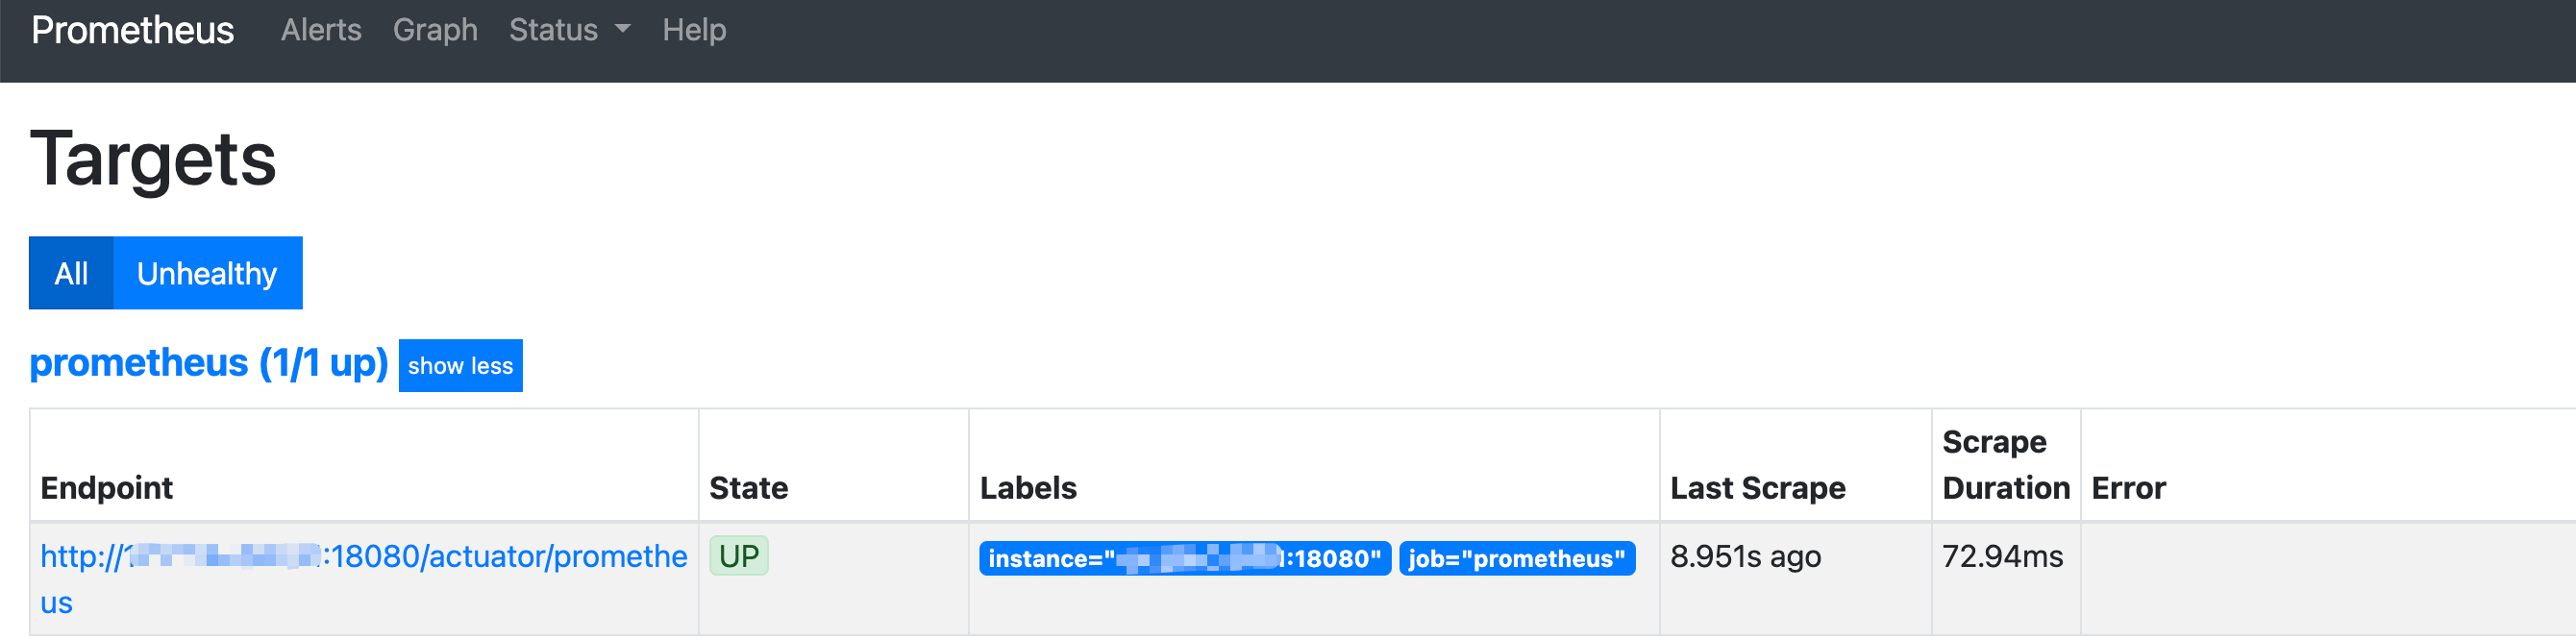
prometheus默认情况下开放的端口为9090,所以完成上述部署工作后我们可以通过ip:9090/targets访问引入的targets,以笔者为例,可以看到我们的应用暴露的端点显示在了prometheus的target映射下:
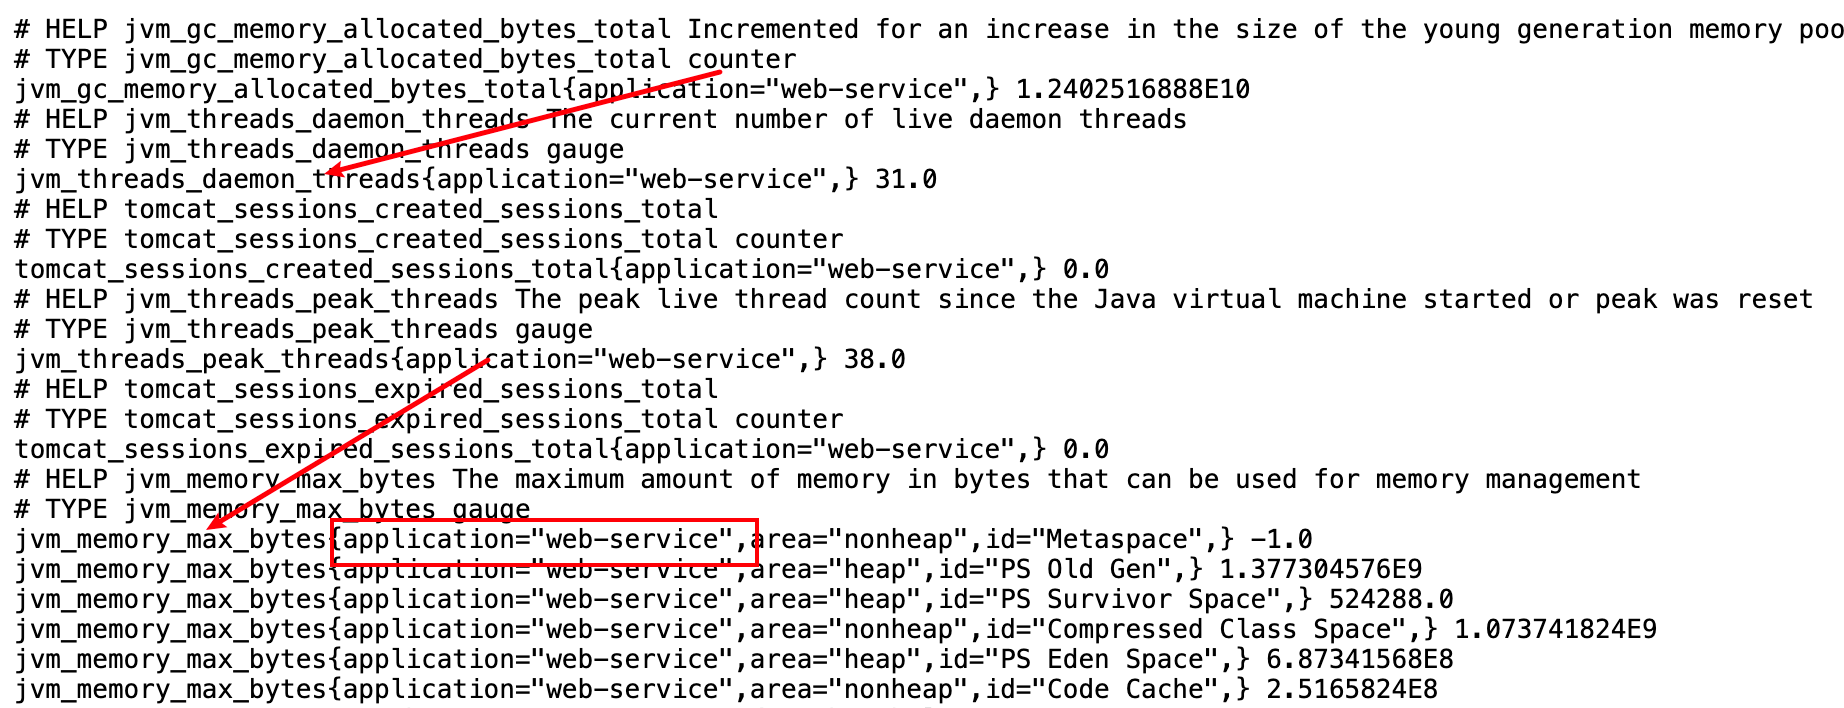
点击该链接地址后,可以看到应用上各个监控指标,同时标签的花括号内部也可以看到笔者全局打上的application标签:
# grafana安装与配置
打通了prometheus数据采集之后,我们就可以通过grafana进行数据增强渲染了,首先自然是完成grafana的下载,考虑到版本兼容性笔者下载的是8.4.1版本,同时考虑到下载速度,笔者这里选用的是阿里云的镜像源:
wget https://mirrors.aliyun.com/grafana/apt/pool/main/g/grafana/grafana_8.4.1_amd64.deb
执行dpkg -i完成grafana安装:
sudo dpkg -i grafana_8.4.1_amd64.deb
将grafana启动并设置开机自启:
sudo systemctl start grafana-server
sudo systemctl enable grafana-server
2
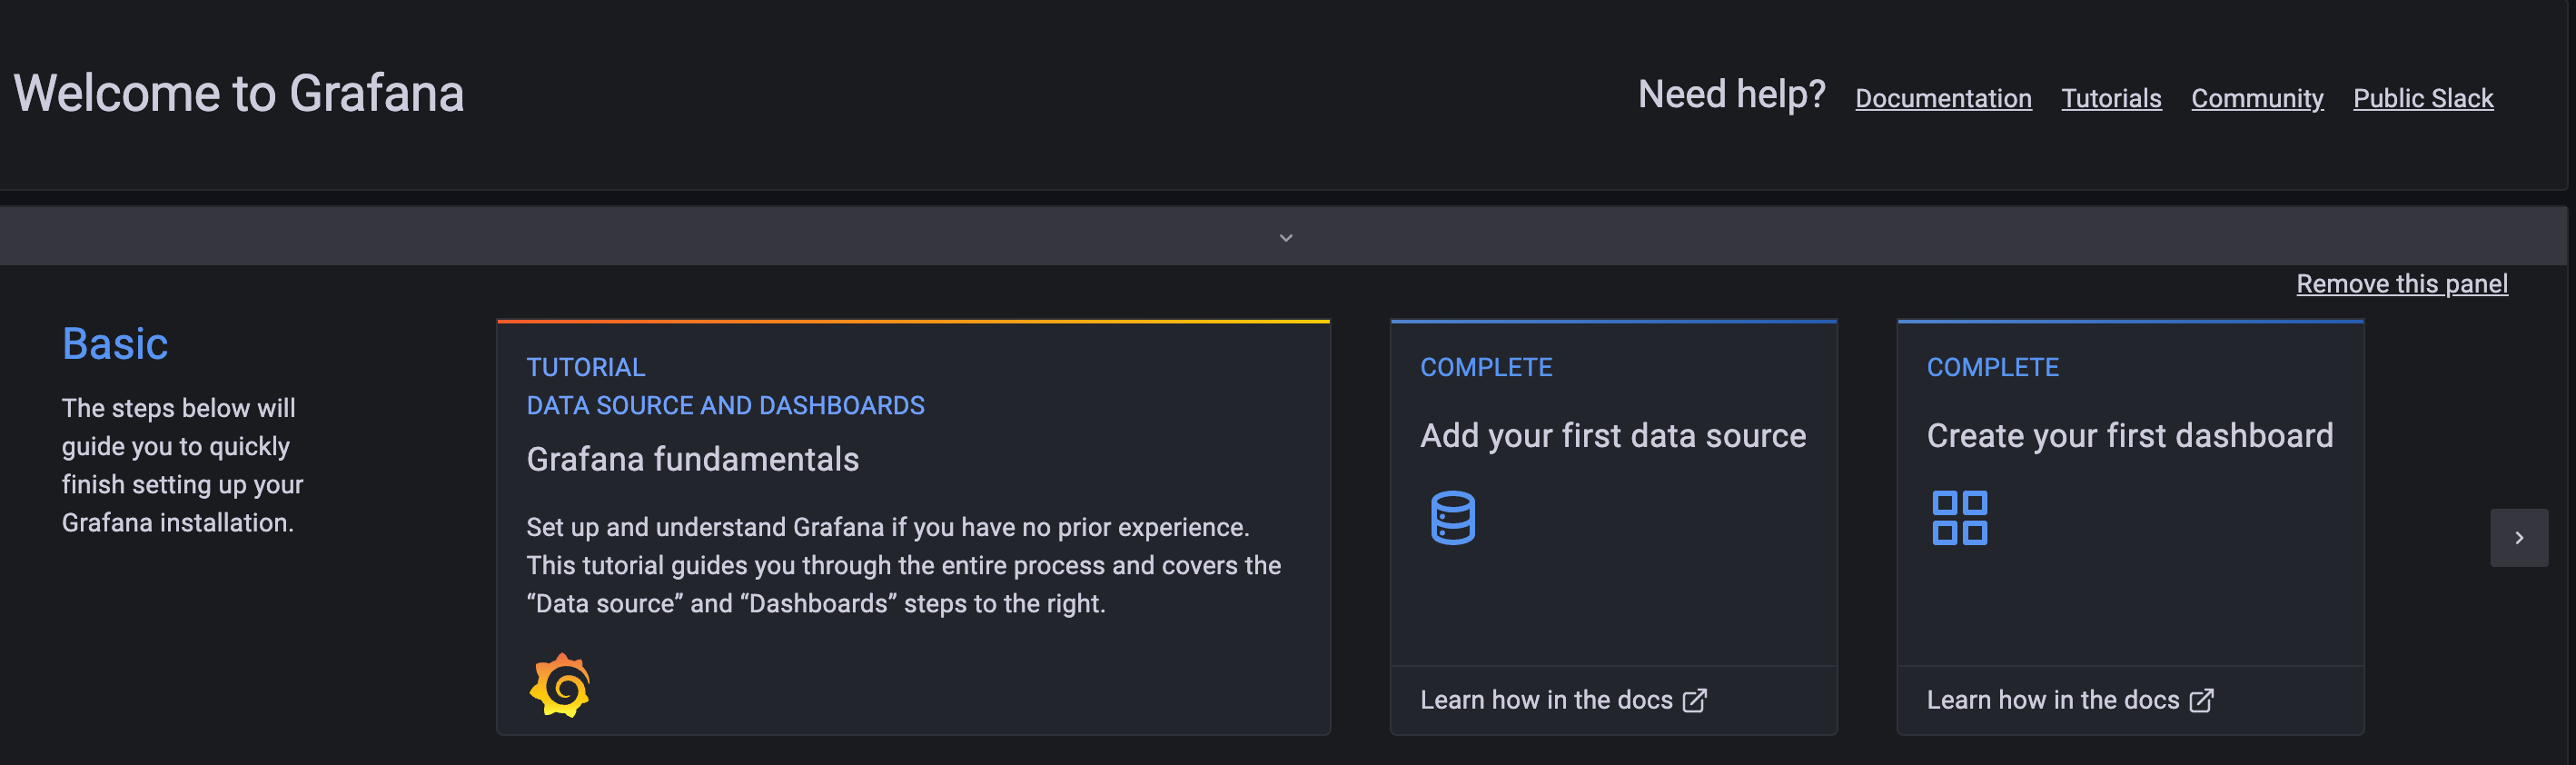
默认情况下grafana开放的端口号是3000,通过ip:3000访问地址并输入默认账号密码admin/admin即可访问该面板:
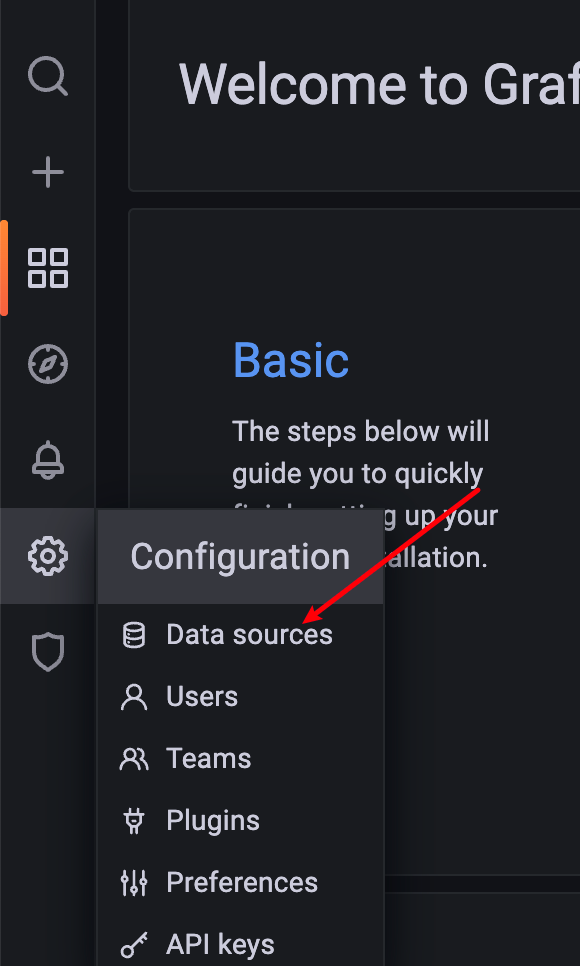
首先我们需要将prometheus的数据源引入,点击configure选择datasource:
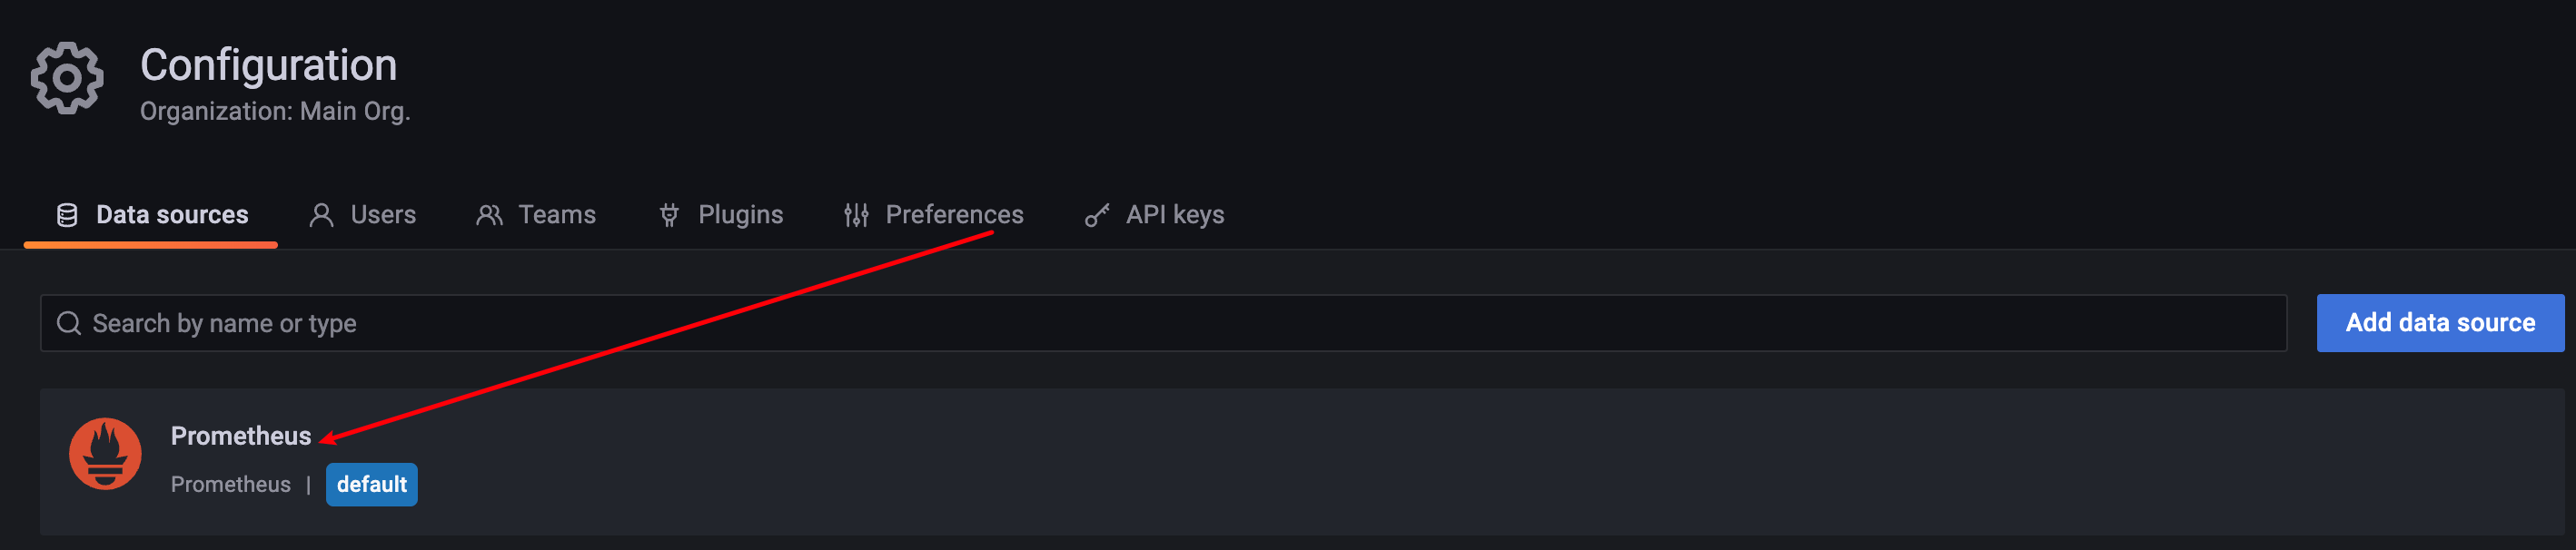
可以看到默认情况下,grafana已经给出了prometheus的配置项,所以我们直接点击这个数据源修改编辑即可:
以笔者为例,所有配置项都选择默认,将url指向prometheus的访问地址即可:
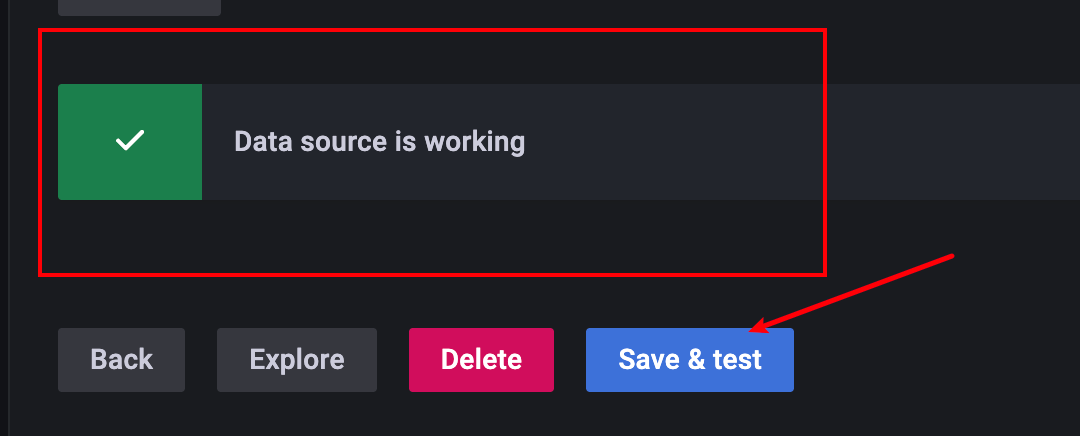
修改URL地址之后,点击save and test,如果界面显示data source is working则说明本次数据源配置成功:
因为grafana社区比较活跃,所以针对各种应用埋点也都内置了强大的模板,所以针对我们的监控数据源也打算采用一些主流的模板来增强监控指标的渲染。
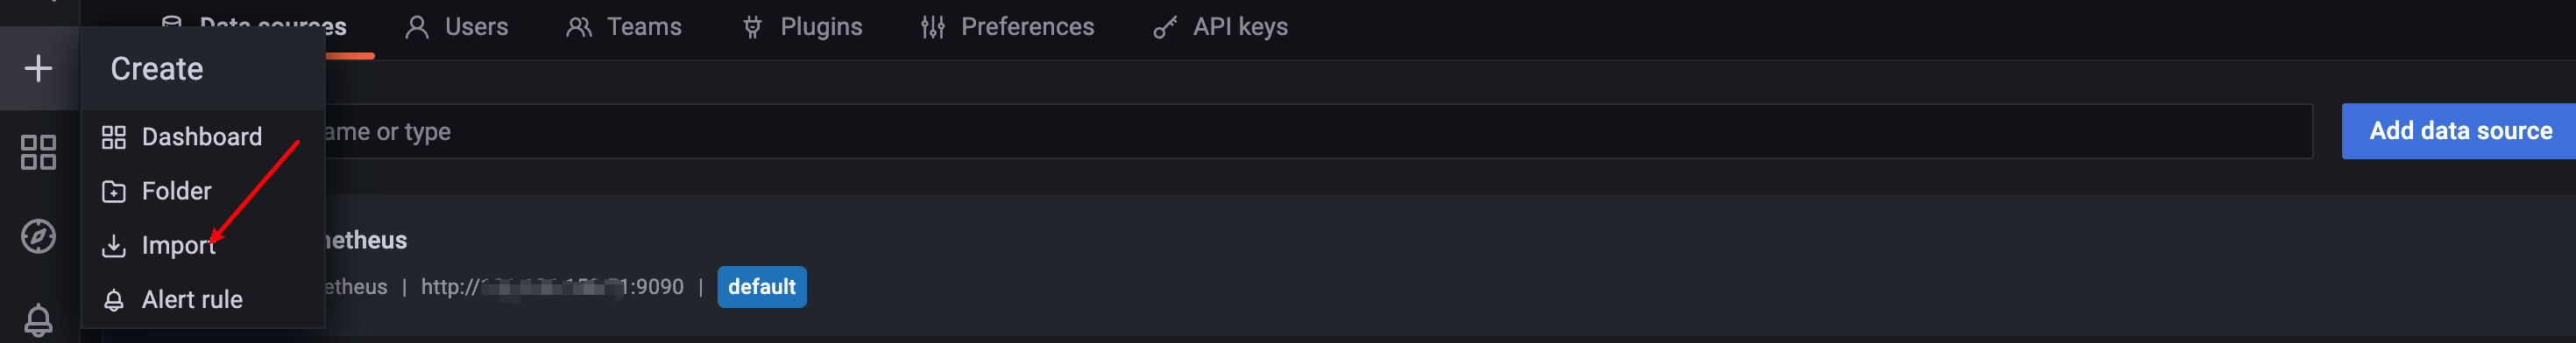
首先我们点击import选择进行模板导入:
通用面板我们可以访问https://grafana.com/grafana/dashboards/ (opens new window) ,并搜索spring boot查看一些通用模板:
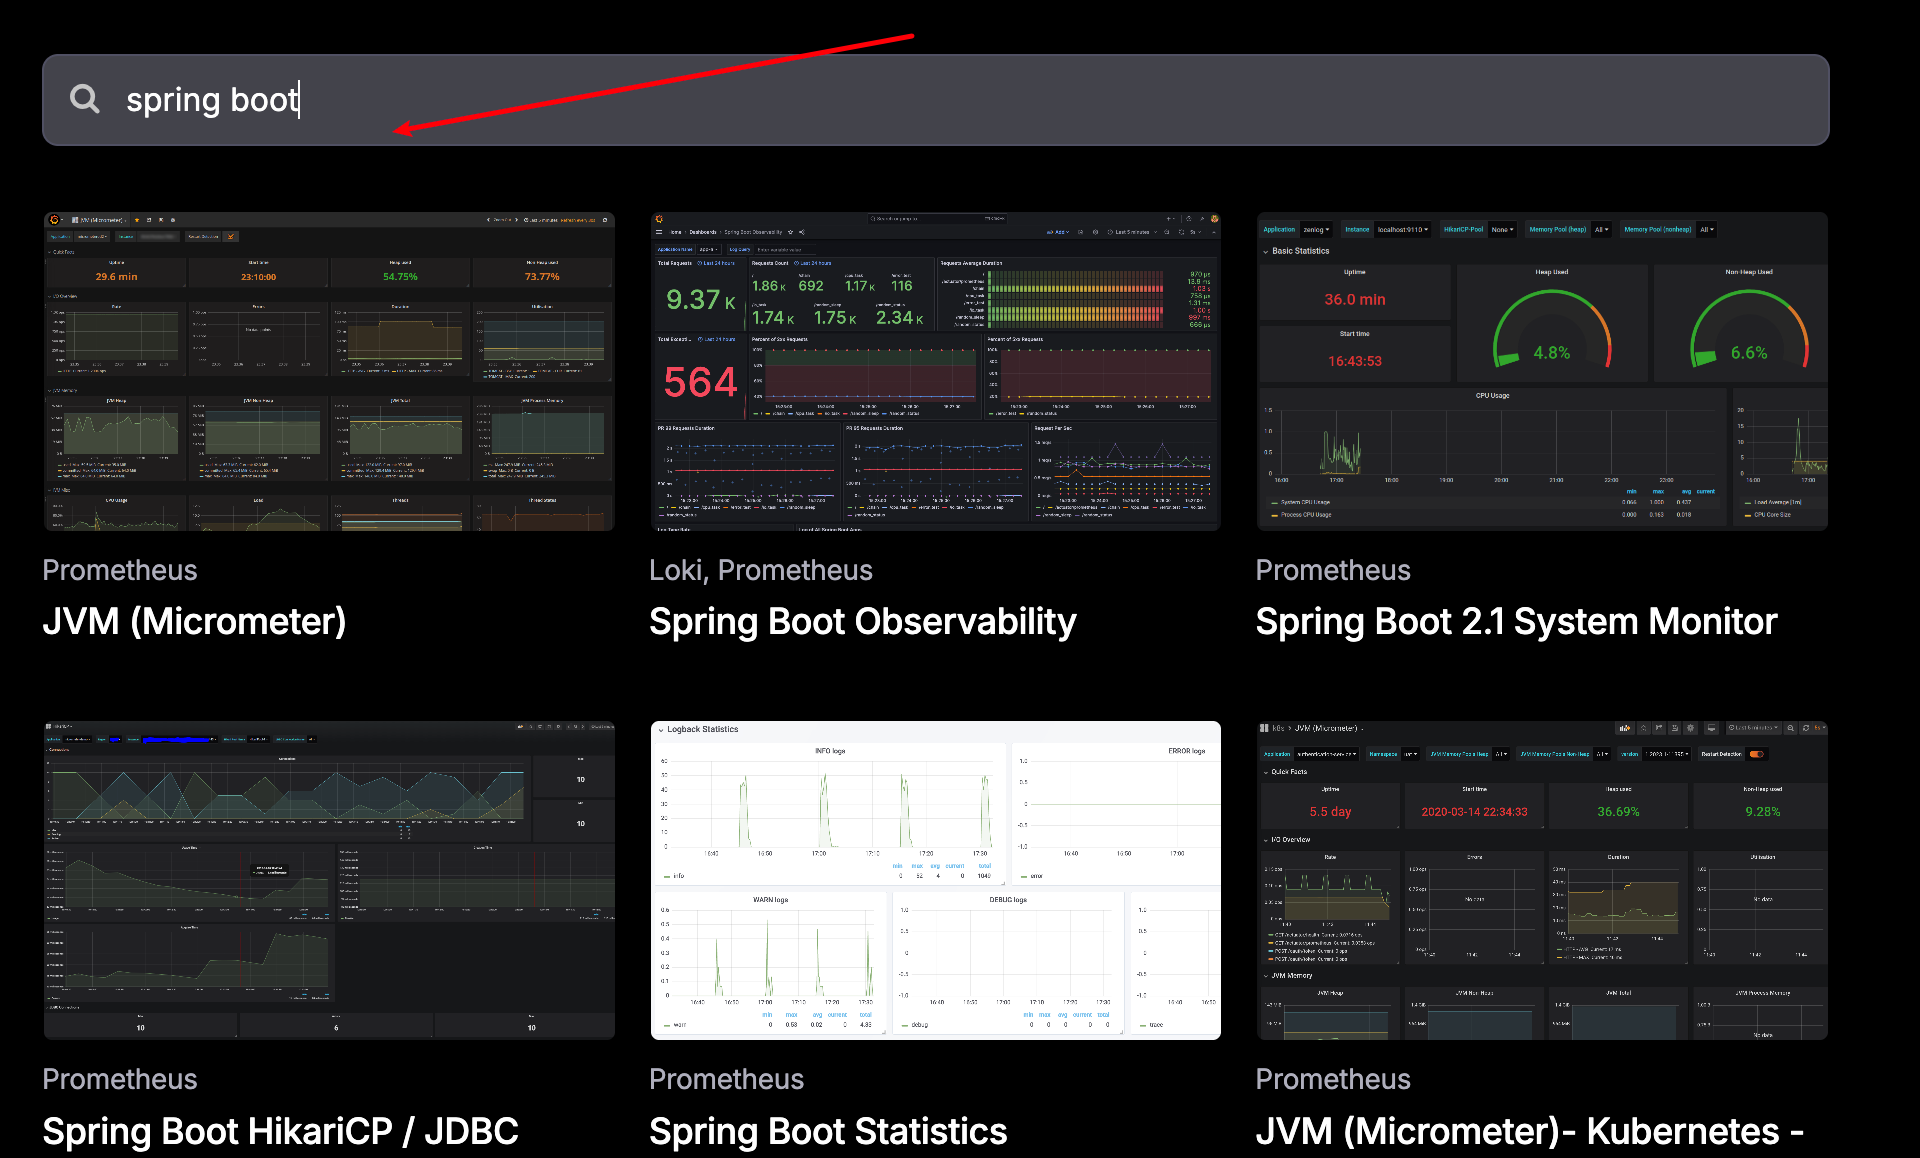
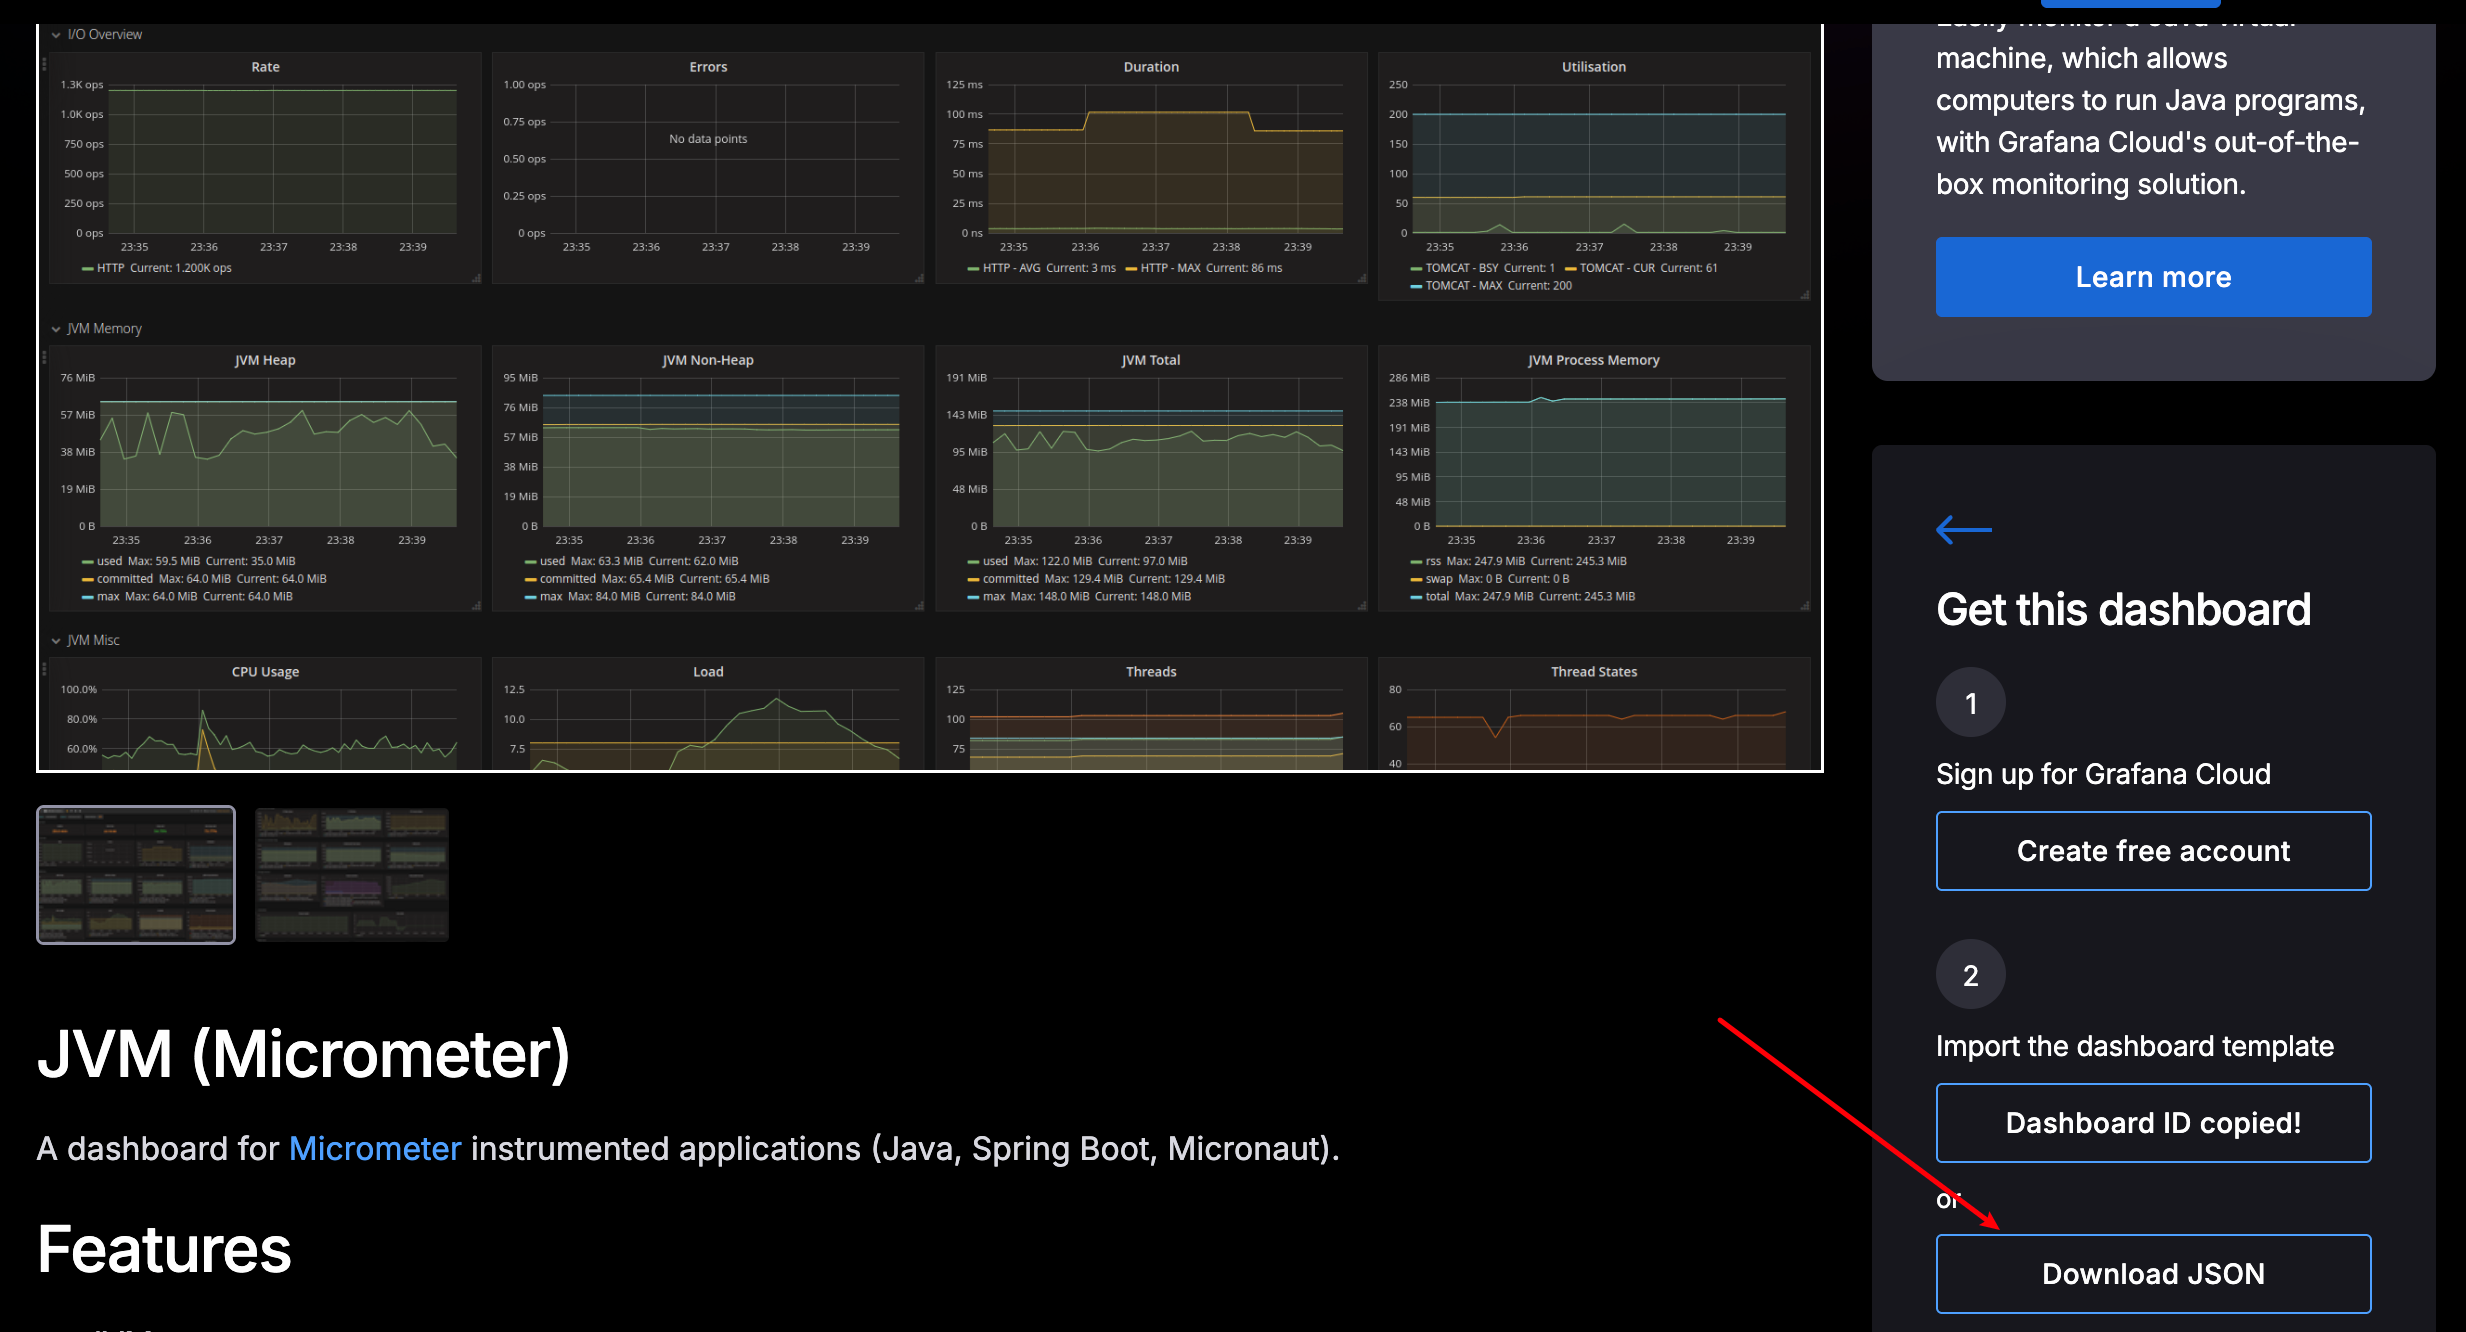
比对各大监控面板,笔者这里选择了JVM (Micrometer)点击download JSON复制模板下载模板文件:
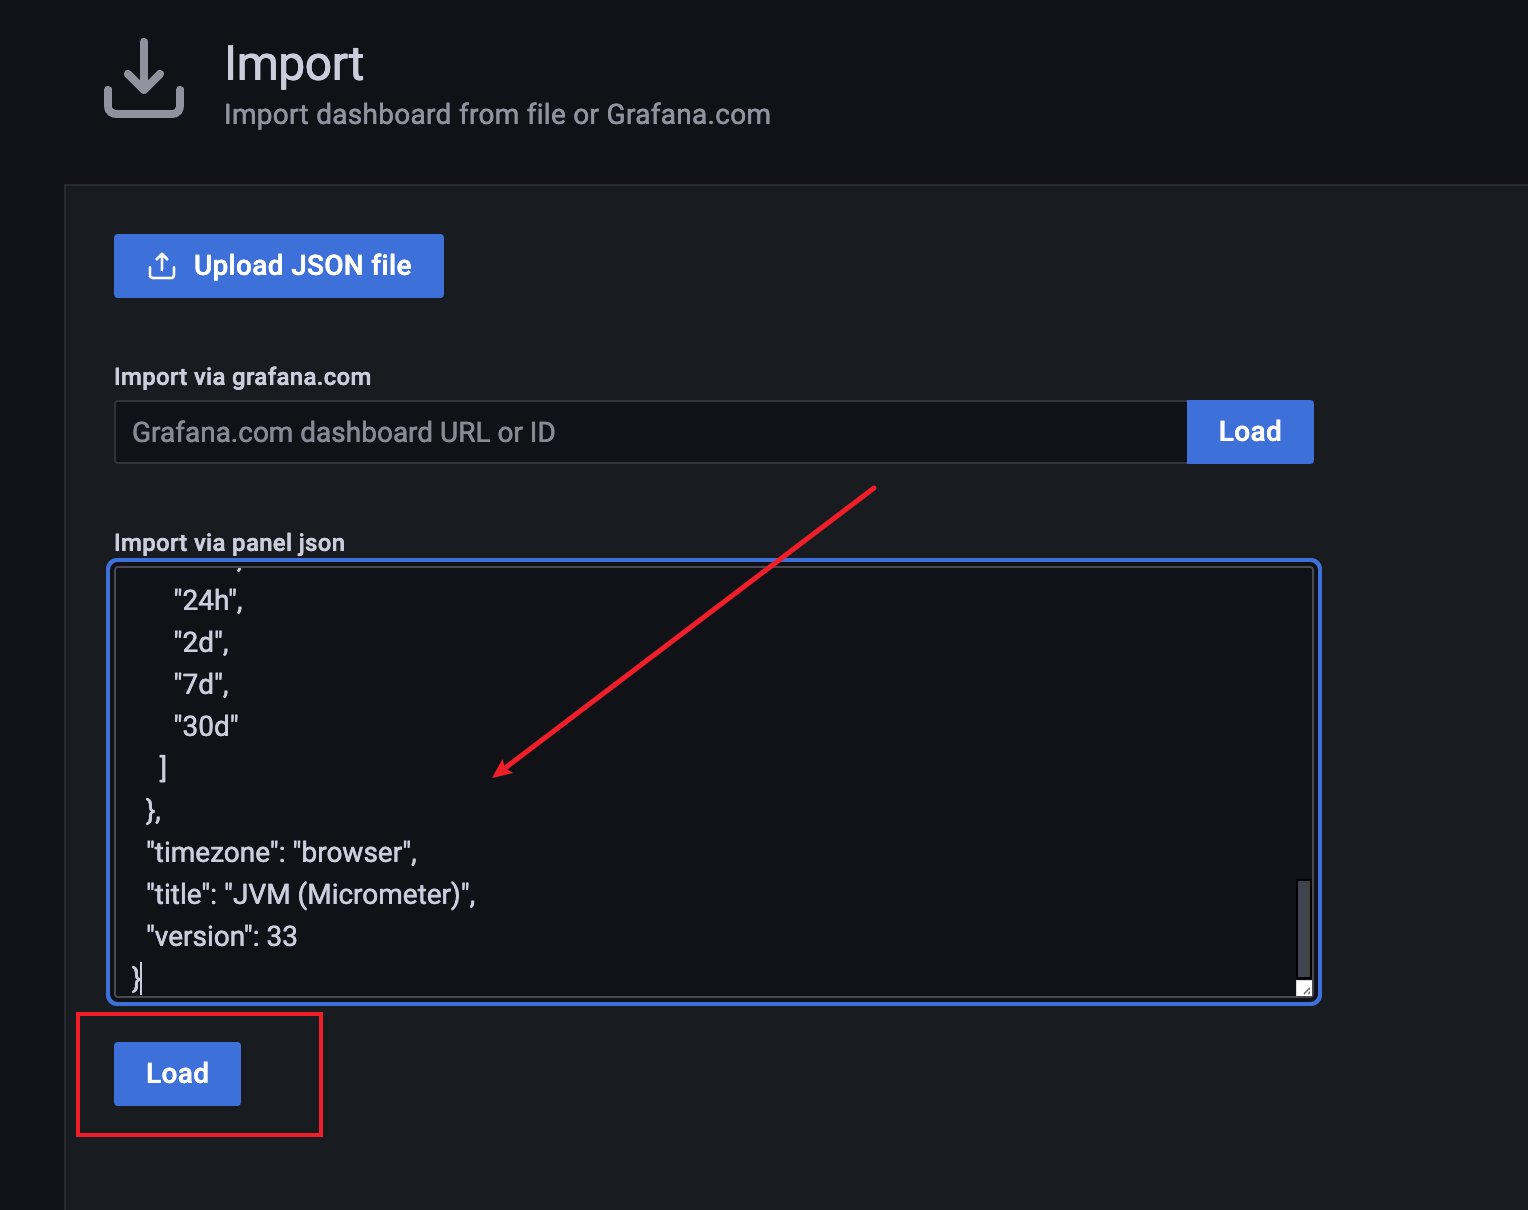
打开下载好的JSON文件并将其导入面板的json选项下并点击load按钮进行加载:
按照提示选择我们配置的Prometheus数据源并点击import:
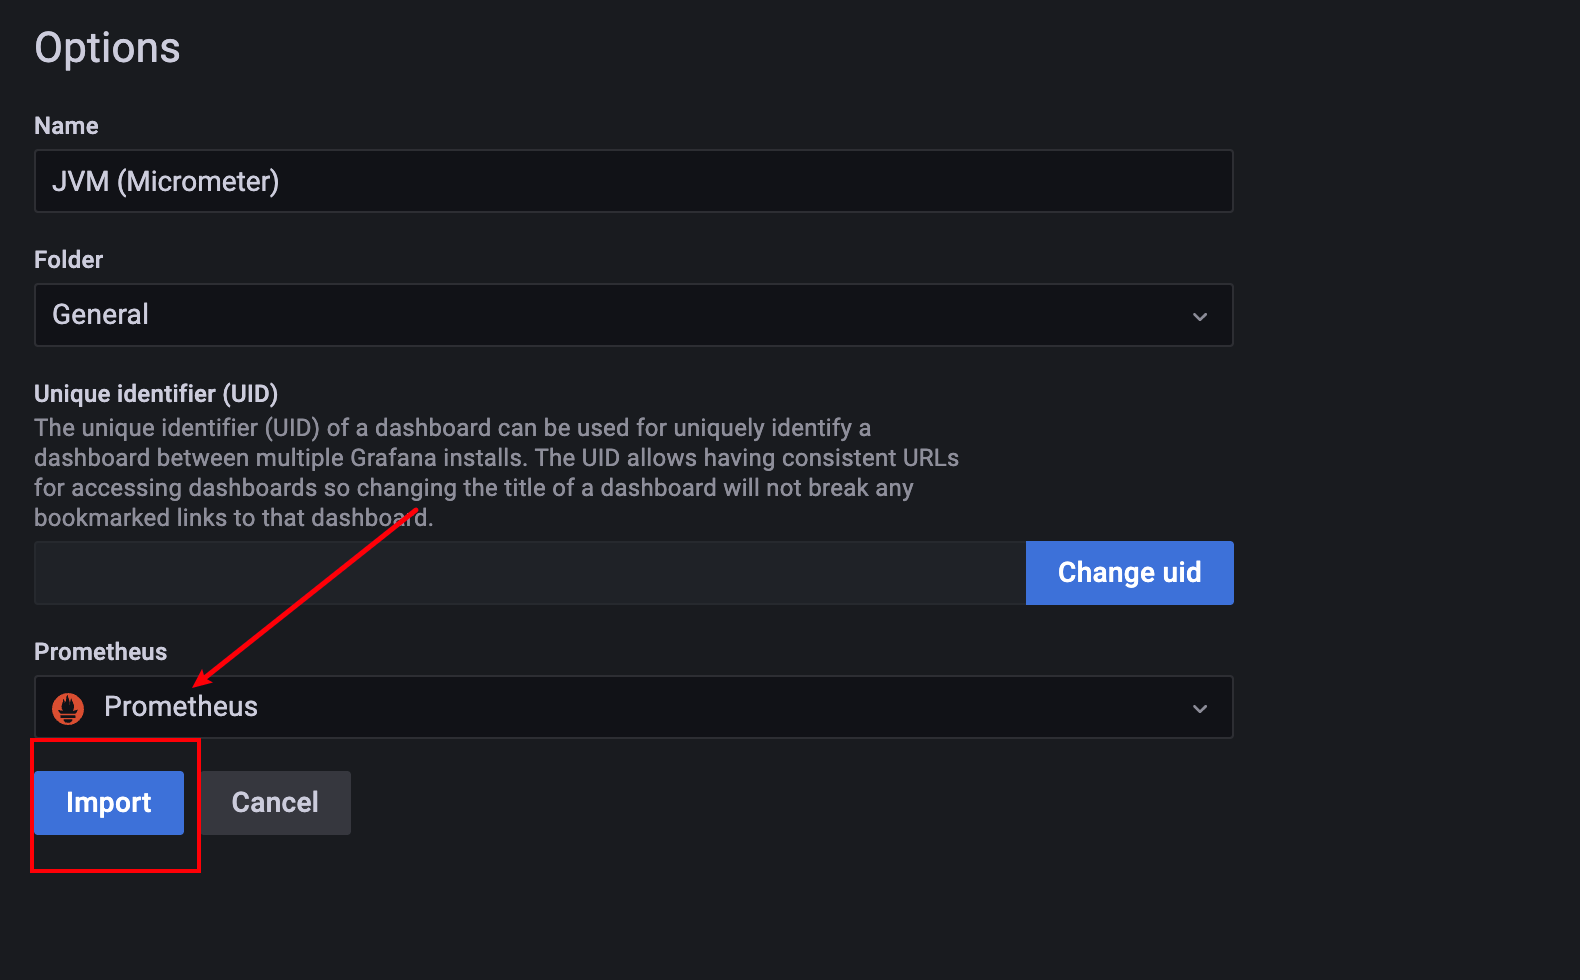
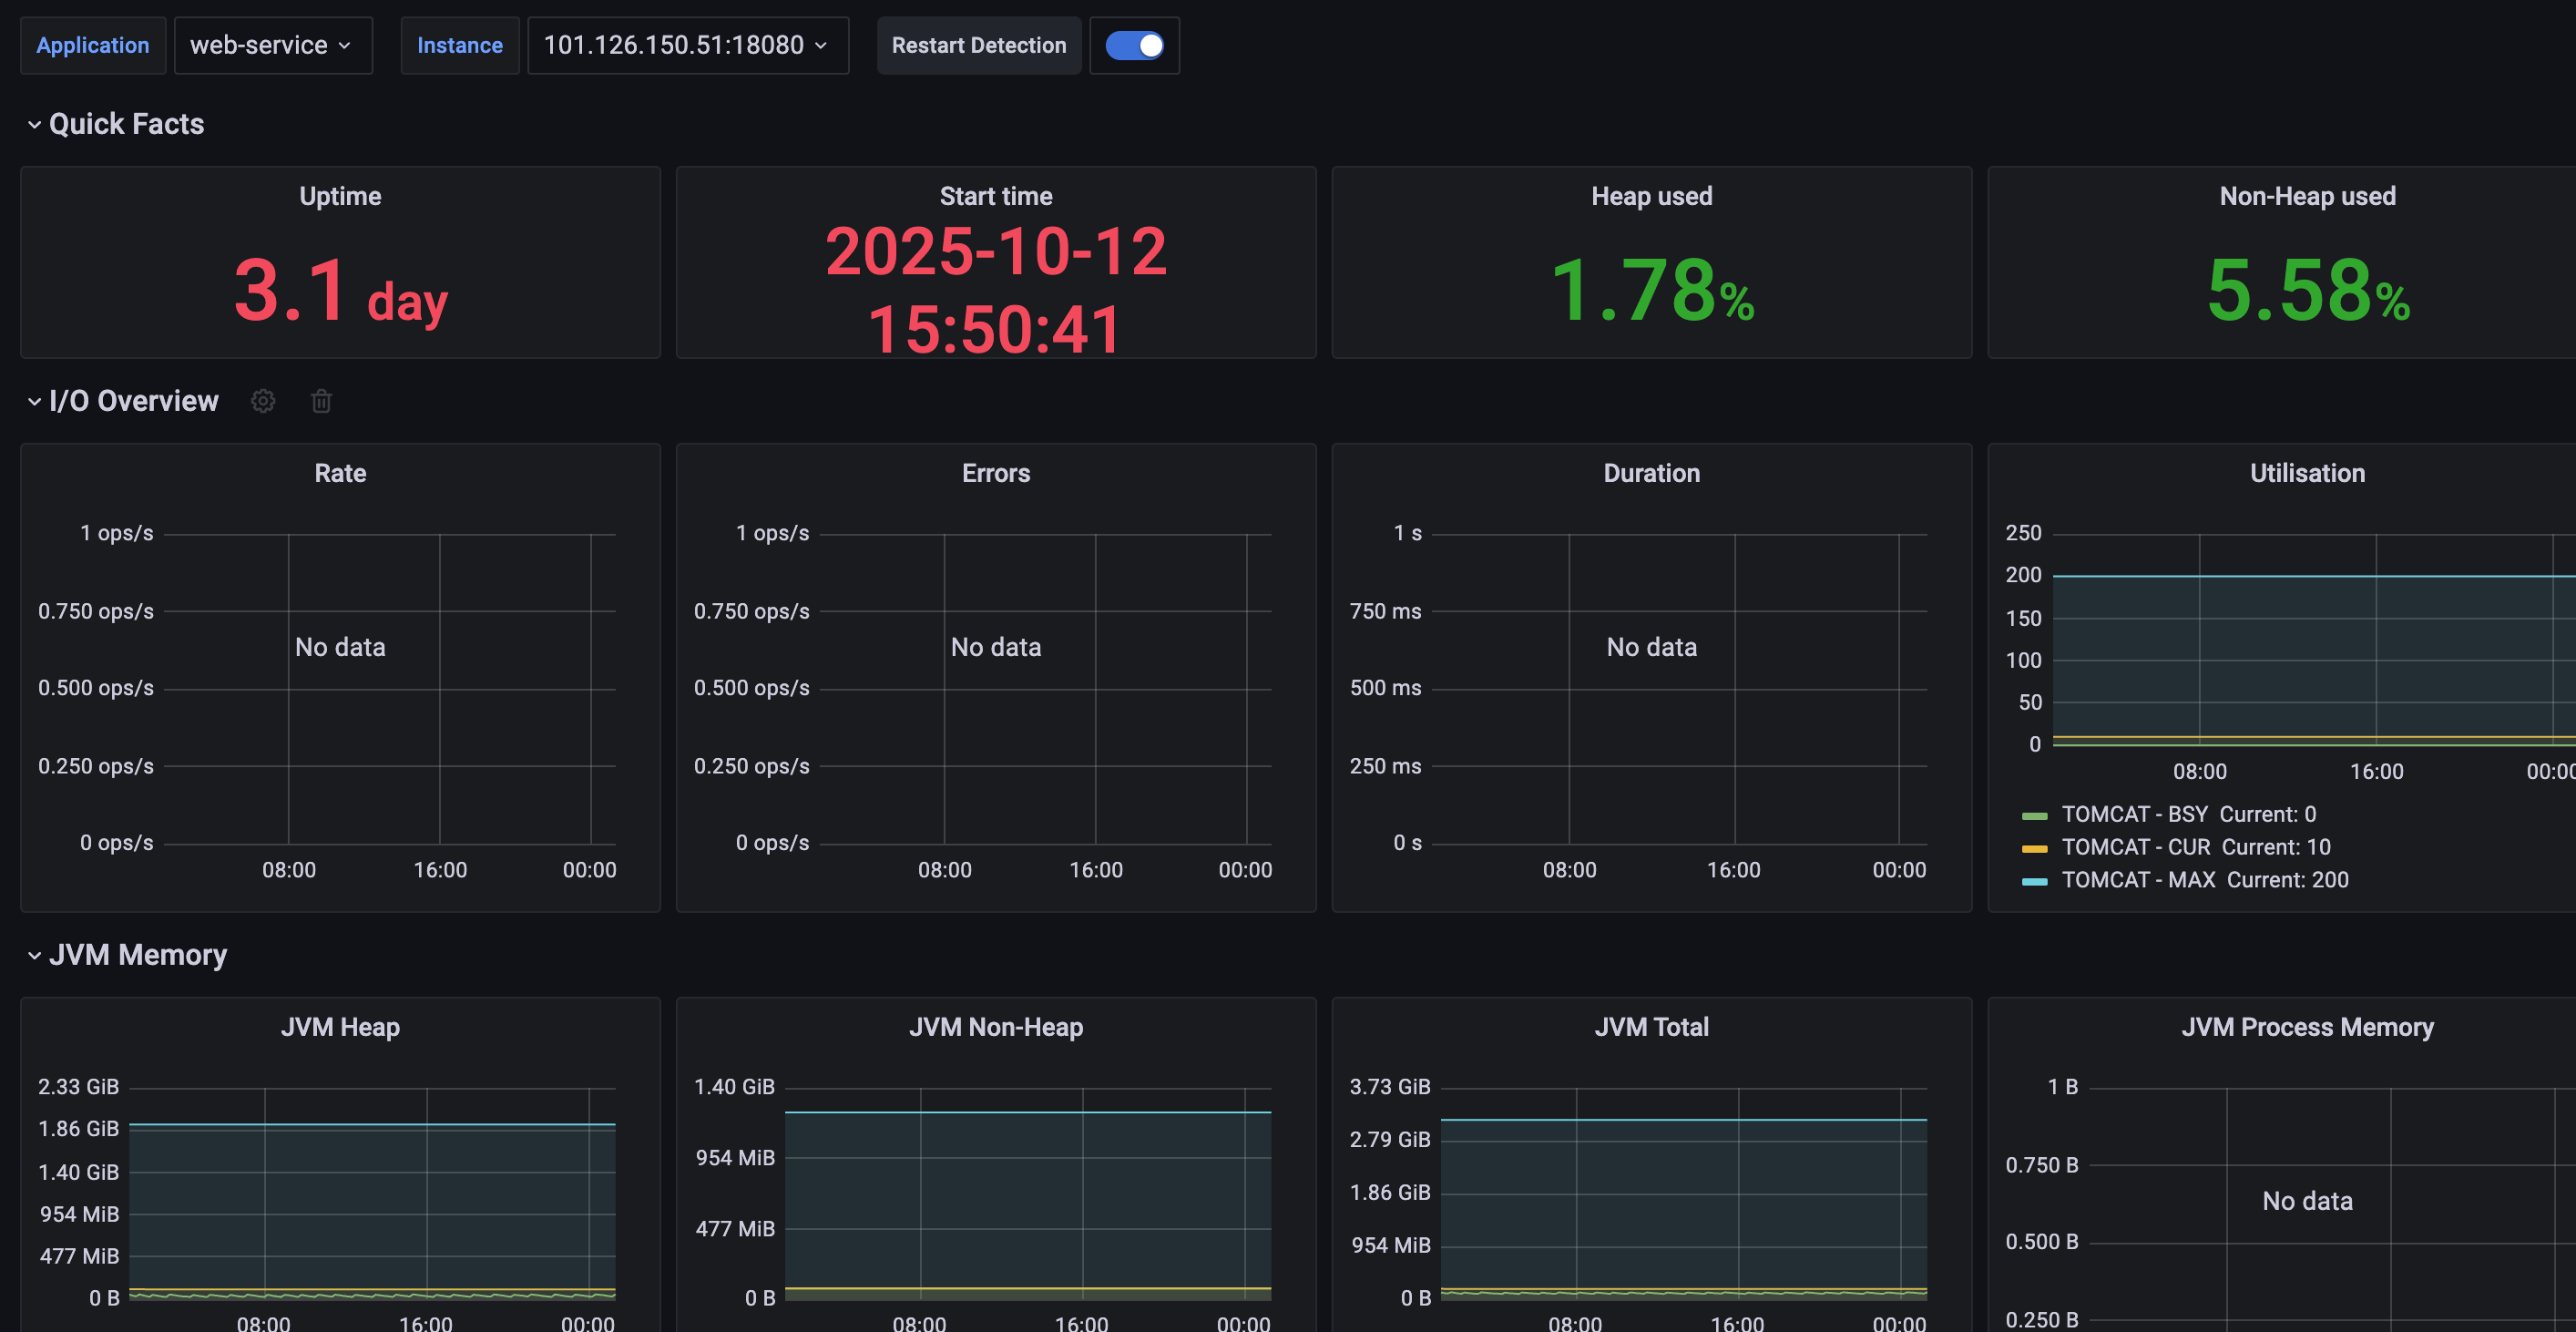
自此,整套监控体系搭建完成:
# 小结
本文通过一张架构图梳理spring boot应用监控埋点的工作原理以及部署方式,然后配置了一个简单的spring boot应用并将其与Prometheus串联,再通过grafana完成监控数据增强渲染便于开发人员快速定位并修复。需要补充的是,本文着重于介绍监控埋点方案的介绍,关于监控指标的原理和应用,逼着会在后续的文章中展开说明。
我是 SharkChili ,Java 开发者,Java Guide 开源项目维护者。欢迎关注我的公众号:写代码的SharkChili,也欢迎您了解我的开源项目 mini-redis:https://github.com/shark-ctrl/mini-redis (opens new window)。
为方便与读者交流,现已创建读者群。关注上方公众号获取我的联系方式,添加时备注加群即可加入。
# 参考
Spring Boot/参考/生产就绪功能/端点 (opens new window)
【Micrometer实战】快给你的SpringBoot做个埋点监控吧! (opens new window)
使用Prometheus和Grafana监控Spring Boot应用 (opens new window)
springboot+Prometheus+grafana 实现自定义监控(请求数、响应时间、JVM性能) (opens new window)
